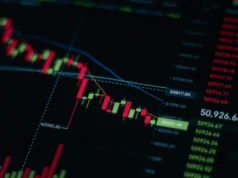
On March 7, 2022, eleven days after Russian tanks crossed the Ukrainian border, Chicago wheat futures closed at their highest level in fourteen years, nearly 50 percent above where they had stood on the eve of the invasion. By late summer prices had fallen back, and the commentary was swift: the system had absorbed the shock, substitute suppliers had mobilised, markets had self-corrected.
That price chart is consistent with two very different accounts of what happened. In the first, the food system is resilient: disruption triggers substitution, prices signal scarcity, supply adjusts. In the second, the system got lucky. A single visible disruption, the closure of Ukrainian Black Sea export terminals, was patched through nearly three months of emergency diplomacy (the Black Sea Grain Initiative, assembled using Turkish leverage and Russian willingness to participate for reasons of its own). Meanwhile a second, less visible disruption unfolded: a fertilizer supply crisis driven by sanctions on Belarusian potash, war-time uncertainty over Russian supply, and an unprecedented European gas price shock, which hit just as farmers across the world needed to buy inputs for the 2022/23 planting season. The food kept moving, but reserves ran down and costs migrated downstream into the next growing season’s prices.
So the chart coming back down cannot settle which story is true; all it records is that the system held on until the pressure eased.
The architecture of an assumption
The case against concern runs like this: no single country produces more than roughly 18 to 19 percent of global wheat. China leads in raw production but is a negligible exporter. The system has absorbed Soviet droughts, US embargoes, Australian floods, and regional conflicts for decades. Prices spike and retreat. The record supports it, and it has earned a certain comfortable complacency.
But “distributed” and “resilient” are not the same thing. In distributed systems such as power grids, financial networks and supply chains, the failure mode that cannot be managed by adding redundant nodes is correlated failure: multiple nodes failing simultaneously because they share a single underlying vulnerability. Charles Perrow identified the structural conditions for this. Perrow was writing about nuclear reactors and chemical plants, but the mechanism he described (tight coupling between components, and complex interfaces where failure propagates in ways invisible until they happen) applies wherever components that appear independent are exposed to common risks. The food system has these properties. What looks like diversified supply is, on examination, supply with correlated exposure. Perrow’s argument is that in such systems serious accidents are “normal”: sooner or later they happen, however many safeguards are added. In his account, when they come, the cause is rarely a single broken component; it is the interface, the place where two systems meet under stress.
The 2008 financial crisis offers the closest analogy outside food systems. Mortgage-backed securities were geographically distributed across the entire United States housing market — banks held them from Maine to California, which was classified as diversification. But every security was exposed to the same underlying variable: national house prices. Nobody categorised this as concentration risk until that variable moved. When it did, geographic distribution turned out to mean nothing. The system failed everywhere at once, because every node, however different it looked, carried the same exposure.
Global grain supply is distributed across dozens of countries and hundreds of trade routes. The right question is whether those sources share failure modes: whether the vulnerabilities that could disrupt them concentrate somewhere. That question has to be asked at three layers (the commercial infrastructure that moves grain, the geography that produces it, and the inputs that make production possible) and then of whatever the system has built to manage failure across all three at once.
Four firms, one pipeline
Two of the four companies that dominate global grain trading, Cargill and Louis Dreyfus, are privately held. They publish headline financial results, but they face none of the stock-market disclosure rules that bind the other two, ADM and Bunge, which are publicly listed — and none of the four reports its trade volumes or trading positions in detail. Together, the four are known as ABCD. Estimates of their combined share of international grain trade span a wide range: in 2012 Oxfam put it at up to 90 percent of global grain trade, while researchers for the European Parliament estimated that the four handled roughly 50 to 60 percent of world trade in essential cereals, oilseeds and protein crops in 2022. That range, from about half to nearly all of international grain trade depending on year, commodity scope and methodology, is evidence that the system cannot quantify its own dependence on these four firms, because the traders disclose so little about what they move.
The opacity matters more than whatever the market share turns out to be, because the ABCD companies own or control substantial portions of the physical infrastructure that internationally traded grain moves through before crossing an ocean: storage silos in the producing regions, grain elevators along the major river systems, port terminals at the export points. They provide the logistics networks and the hedging and financing mechanisms that make international grain trade viable for smaller participants. When these firms face simultaneous operational stress, as they did in February and March 2022 when operations at Ukrainian Black Sea terminals were curtailed, the market does not route around them and instead waits.
The antitrust instinct misreads the problem. Market concentration can be disrupted by regulators. Infrastructure concentration cannot be undone without rebuilding the infrastructure, and opaque infrastructure cannot be stress-tested from the outside. Consolidation is still moving toward more concentration: Bunge and Viterra completed their merger in July 2025, after a regulatory process spanning two years, and the infrastructure layer around the ABCD firms contracted further.
The hidden balance sheet

During the 2022 price spike, commodity derivatives markets experienced extreme volatility. The two privately held ABCD firms faced no stock-market obligation to report their hedging exposure to that volatility. A major financial failure at one of these firms during simultaneous market stress would disrupt more than its own trade flows: it could trigger cascading margin calls across the commodity finance system, extending well beyond grain. How large that exposure was in 2022 is unknowable from the outside, even though these firms sit at the food system's most critical commercial chokepoint.
The Wheat Belt and its weather
Even if the ABCD infrastructure could somehow be bypassed, which it cannot, the supply geography it serves is itself concentrated in ways that the geopolitical framing of most food security coverage tends to obscure.
Russia is the world’s single largest wheat exporter, responsible for roughly a fifth to a quarter of global wheat exports in recent years, including a record 55.5 million tonnes in 2023/24. Ukraine is a major exporter, and Canada’s prairie wheat belt contributes a further significant share. Together, Russia, Ukraine and Canada account for roughly 40 to 45 percent of global wheat export volume. That is short of a majority, but it is a concentration substantial enough that simultaneous disruption in any two of the three would materially stress global supply.
What matters more than the percentage is the shared vulnerability. Russia and Ukraine are both continental Northern Hemisphere climates exposed to the same patterns of extreme summer heat. Canada’s prairie wheat belt depends on precipitation regimes increasingly subject to drought variability. And these are not independent climate risks. The major grain-producing regions of the Northern Hemisphere share exposure to the same atmospheric dynamics: jet stream disruption, Arctic amplification, the northward shift of drought-prone pressure systems. A single anomalously hot, dry Northern Hemisphere summer can simultaneously damage Russian wheat, reduce Canadian spring wheat yields, and stress US winter wheat in the same growing season. The geographic diversification that looks reassuring on a supply map does not translate into climatic independence.
The 2010 Russian heat wave showed what a single-country version of this looks like. The hottest summer Russia had recorded in 130 years cut wheat production by about a third, triggered a government export ban and sent Chicago wheat futures to a two-year high. That was one country in one season, and the probability of several breadbaskets failing together is already rising. Compare 1967–1990 with 1991–2012, and the yearly probability of every major wheat breadbasket facing crop-damaging weather at the same time rises from 0.3 percent to 1.2 percent. This is a documented, increasing probability with a named physical mechanism: amplified jet-stream waves that park heat over several breadbaskets at once. Summers locked in these patterns have cut crop production across the affected regions by about 4 percent on average, and by up to 11 percent regionally.
2010, and what came after

Russia's 2010 heat wave reached the political upheavals of 2011 through grain markets. Russian output fell sharply, an export ban followed, Chicago wheat futures hit a two-year high, and food import costs spiked across North Africa and the Middle East, regions where bread subsidies were already strained and households spent a large share of their disposable income on food. In Tunisia, Egypt and Libya, high food prices were part of the conditions that preceded the Arab Spring protests.
The chemistry of hunger
If the commercial infrastructure concentrates risk at one layer, and the supply geography concentrates it at a second, the input supply system concentrates it at a third.
Roughly four billion people, about half the world’s population, are alive today because of the Haber-Bosch process, which synthesises atmospheric nitrogen into ammonia, mostly using natural gas as the hydrogen source. Outside China, which makes most of its ammonia from coal, the process runs mainly on natural gas, the starting point for just over 70 percent of the world’s ammonia.
When gas prices spike, nitrogen fertilizer production becomes economically unviable at industrial scale. In Europe they rose through 2021 and into 2022, reaching record levels before and after the invasion. And this was not a 2022 story. It started a year earlier, from an energy price shock with nothing yet to do with the war. CF Industries shut both of its UK plants, including Billingham, in September 2021, restarting Billingham only after an emergency deal with the British government. Yara International, one of the world’s largest fertilizer makers, curtailed around 40 percent of its European ammonia production capacity that same month. By the time Russia invaded, European nitrogen output was already significantly below capacity. The fertilizer crisis preceded the war, and the war made it worse.
Phosphate is the second input. Morocco holds approximately 70 percent of the world’s phosphate rock reserves, and its state mining company, OCP Group, is the world’s largest phosphate exporter. Unlike nitrogen, phosphate cannot be synthesised. It is mined from geological deposits laid down over millions of years, and the accessible high-quality reserves are extraordinarily concentrated. There is no Haber-Bosch equivalent for phosphorus, no process that produces it from energy and atmosphere. A governance decision in Rabat can affect the cost of growing food on every continent.
Potash is the third input. Russia holds roughly a third of global potash reserves, Canada about a fifth and Belarus about an eighth. Together, the three countries account for roughly two-thirds of global reserves, and in 2024 for almost 77 percent of world potash exports. Belarusian potash came under EU and US sanctions in 2021: the EU restricted it in June, after the Lukashenko regime forced a Ryanair flight to land in Minsk, and Washington blacklisted the state producer Belaruskali that August. The EU import ban still stands; Washington lifted its Belaruskali sanctions in March 2026. Russian fertilizer was formally exempted from US sanctions after February 2022, and the EU only capped Russian potash imports with a quota (steep EU tariffs on Russian grain and nitrogen fertilizer followed only in 2024 and 2025), yet supply uncertainty from the sanctions on Belarus and Russia still drove potash prices up through the first half of 2022. Potash prices more than tripled between early 2020 and April 2022, when muriate of potash reached an all-time high.
Nitrogen, phosphate and potash all hit extreme price levels in the same window. Natural gas prices drove nitrogen costs. Sanctions on Belarus and uncertainty over Russian supply drove potash. Chinese export restrictions in 2021, combined with broad commodity inflation, drove phosphate. On ordinary days, these inputs price independently, each responding to its own supply and demand dynamics. When energy shocks and geopolitical disruption hit, the same underlying causes move all three simultaneously.
Russia's double role

Russia is simultaneously the world's largest wheat exporter, its largest nitrogen fertilizer exporter, and its second-largest potash producer. Washington deliberately carved Russian food and fertilizer out of its 2022 sanctions, and Brussels spared farm trade apart from a quota on Russian potash until steep tariffs on Russian grain and fertilizer arrived in 2024–25. Yet the war still hit every layer at once: Ukrainian wheat trapped behind a blockade, nitrogen prices driven up by the gas shock, potash prices pushed to records by sanctions on Belarus and uncertainty over Russian supply. A single geopolitical trigger produced three simultaneous food system shocks.
The same trigger, different faces
The food system has three chokepoints: the commercial infrastructure, the supply geography and the input supply. They share structural vulnerabilities, so a simultaneous failure does not require an extreme coincidence: the same triggers can trip all three at once.
Climate extremes are the first of these triggers. A single hot, dry Northern Hemisphere summer can simultaneously damage Canadian wheat, reduce US corn yields, cut Russian grain production, and stress Chinese rice-growing regions through Yangtze drought, reducing river discharge across agricultural systems that are dominant within their respective countries and regions.
These events are linked by more than bad timing: shared atmospheric dynamics such as jet stream disruption and Arctic amplification operate across regions at the same time. Measured across two periods, 1967–1990 and 1991–2012, the yearly odds of all the major wheat breadbaskets facing crop-damaging weather at once quadrupled. The same atmospheric systems drive that rise, turning the supposedly diversified supply map into a single risk surface.
Energy price shocks are the second trigger, and their reach across the food system is wider than most accounts acknowledge. Natural gas prices raise more than nitrogen fertilizer costs. Shipping costs rise too, because bunker fuel prices track the broader energy environment. So do the costs of food processing (industrial drying, refrigeration, packaging) and of synthetic pesticides, which are petrochemical-derived. The ABCD firms pass the higher cost of their storage, drying and logistics through to prices. When energy prices spike, the entire cost architecture of the food system inflates simultaneously rather than in sequence. The 2021-2022 window demonstrated this: fertilizer costs, shipping costs and food processing costs rose together across the same twelve months.
Geopolitical disruption is the third, and Russia is its clearest instance: a single point of failure across three separate layers of the food system. One war, even with Russian food and fertilizer largely spared by Western sanctions, rattled wheat supply, nitrogen fertilizer supply and potash supply at the same time.
The three triggers also couple with and amplify each other, which is the structural condition that makes the food system’s exposure qualitatively different from ordinary supply risk. Climate extremes drive energy demand, which drives energy prices. Energy price volatility creates geopolitical stress around energy supply, which produces supply restrictions and sanctions. Supply restrictions affect energy markets, which affect fertilizer economics. The coupling was visible in the sequence from 2021 through 2022: higher gas prices in Europe in 2021 preceded the Russian invasion and contributed to the political economy that made Russian gas supply a geopolitical instrument.
The food system has no buffer architecture designed for a scenario in which all three triggers are simultaneously active. Strategic grain reserves are sized for single-point disruptions: one country’s harvest fails, and reserves cover the gap while markets adjust. The Agricultural Market Information System (AMIS), launched by the G20 in 2011 after the 2007–08 and 2010–11 price spikes and run from a secretariat at FAO in Rome, publishes regular supply-and-demand balances and market assessments for the major agricultural producers. It is an information system: it can show the problem clearly but has no means to resolve it. The G7’s food security pledges are voluntary.
Designed for the wrong disaster
The institutions are calibrated for the previous disaster. That calibration is a structural feature of how they model risk; it does not stem from a lack of political will.
China holds what the USDA estimates to be the world’s largest grain reserves by volume, though Chinese authorities do not publish official figures and outside estimates vary widely. India maintains large buffer stocks. The WFP’s emergency procurement system allows rapid acquisition of food aid. The Rapid Response Forum of AMIS, set up by the G20 in 2011, brings senior officials of the major producing and consuming nations together to coordinate policy when markets turn — and its joint messages now feed into both G20 and G7 decisions.
What they cannot do is respond to simultaneous correlated failure. If all major exporting regions face supply stress together, there is no substitute supplier to mobilise, and reserves run without resupply because the resupply source faces the same conditions. Should all three fertilizer inputs become unaffordable at once, farmers in every country face the same cost constraint at the same moment; AMIS’s market reports show the problem but cannot resolve it. And with energy prices elevated globally, the logistics infrastructure required to move emergency grain faces the same cost constraints as normal commercial trade.
The failure lies wholly in the model the institutions are running. The OECD-FAO Agricultural Outlook 2025-2034, a standard reference for food security policymakers, describes its baseline as projecting conditions “under expected weather and yield trends, and specific macroeconomic and policy assumptions.”
The Outlook does run 1,000 stochastic uncertainty simulations. But those scenarios replay the past: each simulated year borrows the crop-yield deviations of one historical year between 1995 and 2024, with macroeconomic swings drawn separately, so they capture only the weather correlations the last three decades happened to produce, and they leave policy shocks out altogether. They do not model shocks striking the fertilizer input layer, the trade infrastructure layer and the climate layer together, driven by triggers that are themselves coupled. The USDA World Agricultural Outlook Board’s annual baseline models bounded commodity-level disruptions under standard assumptions, not simultaneous multi-input, multi-exporter correlated stress. These documents shape what policymakers believe is possible. Their blind spot is structural: the shocks they test come from weather and the macroeconomy, never from the input and trade layers giving way at the same moment.
The Black Sea Grain Initiative marks the most that improvisation achieved. Assembling it took Turkish leverage, UN administrative capacity, Russian willingness to participate and nearly three months of emergency diplomacy, from the UN Secretary-General’s first pitch in Moscow and Kyiv in April 2022 to the signing in Istanbul on July 22. It then moved about 33 million metric tonnes in nearly twelve months before Russia terminated it on July 17, 2023. Ukraine opened its own maritime corridor and, by February 2024, was shipping a record 8 million tonnes a month through it (more than 5 million of it farm produce), at higher cost and risk, and only because it could defend the route. The institutional framework registered this as a successful adaptation.
But the Black Sea Grain Initiative addressed one disruption. The simultaneous fertilizer cost crisis had no comparable improvisation available, because no emergency diplomatic agreement makes natural gas cheaper or opens new potash mines on a usable timeline.
The model and the system
Return to the price chart. Its spike and retreat show a Black Sea Grain Initiative negotiated under emergency pressure, fertilizer reserves run down rather than replaced, and farmers in import-dependent countries absorbing input cost increases that won’t surface in the global price index for another growing season.
The food kept moving because every available improvisation was deployed, and the disruptions arrived in a sequence that permitted sequential response.
The food system’s architecture does not guarantee that sequence. Its four trading companies carry internal exposure that is partially unknowable, its major exporting nations sit in the same atmospheric hazard zones, a handful of countries control each of its three fertilizer inputs, and one energy system connects all of them.
The FAO publishes food security scenarios, the USDA publishes supply and demand outlooks, and the G7 convenes task forces. By the standards of their own models, the institutions are doing their jobs.
Those models assume the system will only ever break the way it has broken before, with weather and macroeconomic swings drawn from the historical record while the input and trade layers hold.
The last crisis did not follow that script. A gas price shock and sanctions on a major potash exporter hit fertilizer in the same months that a blockade shut a major wheat exporter’s ports, and the triggers behind them fed one another.
Gen AI Disclaimer
Some contents of this page were generated and/or edited with the help of a Generative AI.
Media
MELQUIZEDEQUE ALMEIDA – Pexels
Key Sources and References
Perrow, Charles. Normal Accidents: Living with High-Risk Technologies. Basic Books, 1984; Princeton University Press, 1999.
Erisman, Jan Willem, Mark A. Sutton, James Galloway, Zbigniew Klimont, and Wilfried Winiwarter. “How a century of ammonia synthesis changed the world.” Nature Geoscience, vol. 1, no. 10, 2008, pp. 636–639. https://doi.org/10.1038/ngeo325
Our World in Data. “How many people does synthetic fertilizer feed?” https://ourworldindata.org/how-many-people-does-synthetic-fertilizer-feed
IEA. Ammonia Technology Roadmap. International Energy Agency, 2021. https://www.iea.org/reports/ammonia-technology-roadmap
Gaupp, Franziska, Jim Hall, Stefan Hochrainer-Stigler, and Simon Dadson. “Changing risks of simultaneous global breadbasket failure.” Nature Climate Change, vol. 10, 2020, pp. 54–57. https://doi.org/10.1038/s41558-019-0600-z
Kornhuber, Kai, et al. “Amplified Rossby waves enhance risk of concurrent heatwaves in major breadbasket regions.” Nature Climate Change, vol. 10, 2020, pp. 48–53. https://doi.org/10.1038/s41558-019-0637-z
Murphy, Sophia, David Burch and Jennifer Clapp. “Cereal Secrets: The world’s largest grain traders and global agriculture.” Oxfam Research Reports, August 2012. https://www-cdn.oxfam.org/s3fs-public/file_attachments/rr-cereal-secrets-grain-traders-agriculture-30082012-en_4.pdf
European Parliament, Directorate-General for Internal Policies. “The role of commodity traders in shaping agricultural markets” (IPOL_STU(2024)747276_EN). 2024. https://www.europarl.europa.eu/thinktank/en/document/IPOL_STU(2024)747276
Bunge Global SA. “Bunge and Viterra Complete Merger to Create Premier Global Agribusiness Solutions Company.” Press release, July 2, 2025 (SEC Form 8-K, Exhibit 99.1). https://www.sec.gov/Archives/edgar/data/1996862/000110465925065405/tm2518720d1_ex99-1.htm
USDA Foreign Agricultural Service. “Grain: World Markets and Trade.” Monthly circular. https://www.fas.usda.gov/data/grain-world-markets-and-trade
Kentucky Farm Bureau. “Market Closes – March 7, 2022.” https://www.kyfb.com/federation/newsroom/market-closes-march-7-2022
Farm Policy News, University of Illinois. “Wheat Soars to 14-Year High.” March 2022. https://farmpolicynews.illinois.edu/2022/03/wheat-soars-to-14-year-high-surge-to-14-possible-citigroup-says/
NPR. “Russian Wheat-Export Ban Sends Futures Prices Higher.” August 5, 2010. https://www.npr.org/sections/thetwo-way/2010/08/05/129009148/russian-wheat-export-ban-sends-prices-higher
Lagi, Marco, Karla Z. Bertrand and Yaneer Bar-Yam. “The Food Crises and Political Instability in North Africa and the Middle East.” arXiv:1108.2455, 2011. https://arxiv.org/abs/1108.2455
USGS. Mineral Commodity Summaries 2026: Potash; Phosphate Rock. U.S. Geological Survey, February 2026. https://pubs.usgs.gov/periodicals/mcs2026/mcs2026-potash.pdf · https://pubs.usgs.gov/periodicals/mcs2026/mcs2026-phosphate.pdf
USGS. Mineral Commodity Summaries 2024. U.S. Geological Survey, January 2024. https://pubs.usgs.gov/periodicals/mcs2024/mcs2024.pdf
Natural Resources Canada. “Potash facts.” https://natural-resources.canada.ca/minerals-mining/mining-data-statistics-analysis/minerals-metals-facts/potash-facts
U.S. Department of the Treasury, OFAC. “Food Security Fact Sheet: Russia Sanctions and Agricultural Trade.” July 14, 2022. https://ofac.treasury.gov/media/924341/download
U.S. Department of the Treasury, OFAC. “Belarus Designations Removals; Issuance of Belarus General License; Rescission of Belarus Directive 1.” March 26, 2026. https://ofac.treasury.gov/recent-actions/20260326
European Commission. “Trade in agricultural and related products from Russia — Frequently asked questions” (Council Regulation 833/2014). As of June 22, 2022. https://finance.ec.europa.eu/system/files/2022-08/faqs-sanctions-russia-agriculture_en.pdf
Council of the European Union (via EEAS). “Council sets higher tariffs on Russian and Belarusian grain products.” May 30, 2024. https://www.eeas.europa.eu/delegations/ukraine/council-sets-higher-tariffs-russian-and-belarusian-grain-products_en
European Commission, Access2Markets. “EU increases tariff duties on Russian and Belarusian imports of agricultural products and fertilizers” (Regulation (EU) 2025/1227). 2025. https://trade.ec.europa.eu/access-to-markets/en/news/eu-increases-tariff-duties-russian-and-belarusian-imports-agricultural-products-and-fertilizers
EU Sanctions Map. Belarus: restrictive measures (potassium chloride import ban, Regulation (EC) 765/2006, Annex VIII). https://www.sanctionsmap.eu/
BusinessLIVE (Reuters). “EU imposes tough sanctions on Belarus.” June 24, 2021. https://www.businesslive.co.za/bd/world/europe/2021-06-24-eu-imposes-tough-sanctions-on-belarus/
Schnitkey, Gary, Carl Zulauf, Krista Swanson, Nick Paulson and Jim Baltz. “Potential Disruptions in Nitrogen Fertilizer Trade.” farmdoc daily (12): 57, University of Illinois, April 26, 2022. https://farmdocdaily.illinois.edu/wp-content/uploads/2022/04/fdd042622.pdf
CF Industries Holdings. “CF Industries Holdings, Inc. Commences Restart of Ammonia Plant at Billingham, UK, Complex.” Press release, September 21, 2021. https://www.cfindustries.com/newsroom/2021/billingham-restart
Yara International. “Yara Curtails Ammonia Production Due to Increased Natural Gas Prices.” Press release, September 17, 2021. https://www.yara.com/corporate-releases/yara-curtails-ammonia-production-due-to-increased-natural-gas-prices/
Rural 21. “AMIS – enhancing food market transparency and policy coordination.” 2023. https://www.rural21.com/english/archive/2023/02/detail/article/amis-enhancing-food-market-transparency-and-policy-coordination.html
OECD and FAO. OECD-FAO Agricultural Outlook 2025-2034. OECD Publishing, Paris, 2025. https://doi.org/10.1787/601276cd-en
FAO Food Price Index. Food and Agriculture Organization of the United Nations. Monthly data. https://www.fao.org/worldfoodsituation/foodpricesindex/en/
United Nations. Black Sea Grain Initiative: Joint Coordination Centre. Data and reports, 2022–2023. https://www.un.org/en/black-sea-grain-initiative
Ukrinform. “Ukraine’s exports via maritime corridor hit record high of 8M tonnes in Feb 2024.” https://ukrinform.net/rubric-economy/3834459-ukraines-exports-via-maritime-corridor-hit-record-high-of-8m-tonnes-in-feb-2024.html