Last updated: · 15 min read
In brief
Robert Solow wrote in 1987 that the computer age was everywhere but in the productivity statistics. Nearly four decades on, the same line is being recycled about AI. Free digital goods that GDP misses cannot explain the slowdown, because their value is far too small. The real lesson comes from electricity. Factories saw no productivity surge for roughly forty years, until new plants were designed around the electric motor. For AI to break the loop, firms would have to rebuild around it instead of doing old work slightly faster.
Contents
“You can see the computer age everywhere but in the productivity statistics.” Robert Solow wrote that in 1987, almost in passing, deep inside a book review for the New York Times Book Review. It became one of the most quoted sentences in economics, the founding line of what is still called the Solow productivity paradox.
In August 2024, three researchers at the Richmond Fed opened a brief on AI and the workforce by quoting Solow’s sentence word for word and applying it to artificial intelligence. In early 2026, Apollo’s chief economist Torsten Slok put it more bluntly still: “AI is everywhere except in the incoming macroeconomic data.” Nearly four decades on, the same sentence had been recycled about a completely different technology.
Whatever produced the original paradox was never resolved. The computer age did eventually show up in the statistics, briefly, between 1996 and 2004, and then vanished from them again. Now a new technology is doing the same thing, transforming visible daily life while the productivity numbers refuse to move.
Twice now, a transformative technology has opened the same gap between what you can see and what the data records. The gap comes from a specific confusion between technological impressiveness and the structural reorganization that drives aggregate growth, one we keep making because we have never properly diagnosed it.
The numbers
The scale of the slowdown is easy to understate because percentages obscure compounding. US private nonfarm business productivity, or output per hour worked, grew at roughly 2.9% a year from 1948 to 1973. After 1973 it averaged closer to 1.8%, and apart from one burst between the mid-1990s and 2004 it has never returned to the old pace. Had the pre-1973 rate held, US output per hour today would be roughly 75% higher than it is, a gap worth trillions of dollars of output every year.
Robert Gordon frames this as the end of a “special century”: output per hour grew at 2.82% a year from 1920 to 1970, compared with about 1.5% in the decades before 1920 and about 1.6% after 1970. TFP growth, the deeper measure that strips out capital accumulation, ran at almost triple its pre-1920 and post-1970 rates during that central period. On that reading, the decades since 1970 mark a return to the older, slower pace.
The most recent data does little to change this picture. US private nonfarm business labour productivity grew 3.0% in 2024, a cyclical rebound, then 2.2% in 2025, and nonfarm business productivity was still growing 2.2% year on year in mid-2026: respectable, and still short of the postwar pace. Across the OECD, labour productivity grew about 1.2% in 2024, better than the year before.
The obvious explanations fall away quickly. The problem is not specific to the US; the slowdown shows up across developed economies. Nor is it an aftershock of the 2008 financial crisis: the slowdown began in 1973, and the post-2004 deceleration predates the crisis by four years.
It is not temporary either, since fifty years is far longer than a business cycle. Nor is it simply a composition effect from the shift toward services, because the slowdown hit manufacturing and services alike.
Labour productivity versus total factor productivity

Labour productivity, or output per hour worked, can rise purely because firms invest in more or better equipment per worker. A factory that buys each worker a faster machine raises output per hour without becoming any more efficient. Total factor productivity strips out this capital deepening and isolates the residual: how much more output the economy produces from the same inputs. Economists treat TFP as the fundamental measure of long-run growth potential, because when it stagnates, capital accumulation alone cannot sustain growth indefinitely.
The measurement escape hatch
The most comfortable explanation is that the slowdown is a statistical illusion. GDP measures market transactions. Free digital goods such as Google Maps, Wikipedia and free-to-use social media give users far more value than anything they pay, and GDP, which counts what is paid, misses most of that value. On this view we are richer than GDP says, and the productivity crisis is a measurement crisis in disguise.
Erik Brynjolfsson and co-authors tried to put a number on the missing value. They built a framework called GDP-B to estimate the consumer surplus from free digital goods by asking people what they would accept to give a service up.
The median US Facebook user, they found, would require about $42 a month to give up access. None of that surplus shows up in GDP.
Chad Syverson has shown that mismeasurement cannot be a sufficient explanation. His empirical case has four parts. Start with geography: the productivity slowdown is a cross-country phenomenon, and its size is unrelated to how intensively countries use information and communications technology (ICT). If the slowdown were a measurement artifact of digital economies, it should be most severe in the most digital ones, and it is not. Labour productivity growth slowed in 29 of the 30 OECD countries he examined, by 1.2 percentage points a year on average, whether or not they were heavy users or producers of digital technology.
Then there is scale. The total “missing output” implied by the post-2004 productivity slowdown, meaning the gap between what GDP would have been at the 1995–2004 trend and what it turned out to be, came to roughly $3 trillion a year by 2015. Every estimate of the consumer surplus from internet-era digital goods that Syverson examined covers only a small fraction of that gap. Later work only sharpens the point: by the GDP-B estimates, counting Facebook’s unmeasured value adds 0.05 to 0.11 percentage points a year to growth, while the slowdown itself knocked about 1.5 percentage points a year off labour productivity growth.
Nor does the industry data cooperate. For mismeasurement to account for even a modest fraction of missing output, ICT-producing and ICT-intensive industries would have needed unmeasured productivity growth rates that were multiples of their measured rates. The inter-industry data does not support this. The sectors most plausibly producing unmeasured digital value show no such anomalous gap between their measured and implied productivity.
And in the decade after 2004, gross domestic income ran slightly ahead of gross domestic product — the pattern you would expect if workers were being paid to make things given away for free. But GDI began outpacing GDP in 1998, in the middle of the productivity boom, and the extra income went to profits rather than wages. Neither the timing nor the distribution fits the hidden-output story.
Syverson does not deny that digital goods carry unmeasured value. His point is that the value is an order of magnitude too small to explain what happened. And the mismeasurement hypothesis has no answer to the cross-country evidence.
How GDP-B works

To estimate consumer surplus, GDP-B uses incentive-compatible discrete choice experiments: respondents choose between keeping a service and receiving a cash payment, with real money at stake. The estimates are meaningful but noisy, since they capture what people say they would accept, under conditions designed to elicit truthful responses. A welfare gain of about $42 a month per Facebook user, even summed across every American on the platform, does not approach $3 trillion in missing annual output.
What made the special century special
If the measurement story doesn’t explain the slowdown, the question shifts: what drove the fifty years of growth that we have not been able to replicate? The common summary of Gordon’s argument, “IT is overrated,” misses the structural claim underneath it.
The inventions of 1870–1940 abolished whole chores. Before running water, the average American household lugged around 9,000 gallons of water a year, hauling it in, heating it on the stove and carrying it back out; indoor plumbing ended that chore outright. Refrigeration made an entire category of domestic labour unnecessary: the icebox had already reduced spoilage, but mechanical refrigeration eliminated the daily shopping trip that perishability required. Electrification transformed laundry. For one farm wife surveyed in 1945–46, a 38-pound load of laundry that took about four hours the old way took 41 minutes once the household had an electric washer, dryer, running water and a water heater.
Each invention removed, once and for all, an activity that had consumed a large share of household time. Women entered the paid workforce in large numbers partly because the domestic labour that had kept them out was taken over by machines.
Gordon’s comparison to IT turns on the difference between improving a tolerable task and eliminating an intolerable one. Email accelerated letter-writing, but letter-writing was never an economy-wide bottleneck: nobody spent hours a day on correspondence the way households once spent them hauling water and scrubbing laundry by hand. Search engines sped up information retrieval at the margins of knowledge work, and finding information never constrained the economy the way food preservation and transport did.
Tyler Cowen widens the frame. In his account, the growth of 1880–1970 rested on three forms of low-hanging fruit. The first was free land: the continental frontier, taken from the Native nations who lived on it, and much of it handed to homesteaders for a filing fee, provided they lived on the land, built a home and farmed it. The second was the rapid translation of 18th- and 19th-century science into working technology: the basic science of thermodynamics, electromagnetism and germ theory, accumulated over centuries, was converted into electric power, internal-combustion engines, and modern sanitation in a compressed burst between 1880 and 1940. The third was the large return from educating previously uneducated populations, which took high school completion from a rarity to a near-universal norm, with each additional year of schooling producing large marginal returns because the starting base was so low.
All three were one-time conditions rather than renewable features of industrial economies: you cannot discover free land twice, or make the transition from mass illiteracy to mass literacy a second time. The internet, Cowen argued, delivers enormous enjoyment, much of it free, but “in terms of revenue and jobs, the Internet has not added as much value as most people think.” When he wrote, Twitter employed about 300 people and Google about 20,000, headcounts that would have been a rounding error in the automobile age.
Gordon and Cowen disagree about how closed the future is — Gordon more pessimistic about transformative innovation resuming, Cowen leaving the door open. But they agree on the diagnosis: the post-1970 slowdown is structural, rooted in the economy itself rather than in the business cycle or the statistics.
Their agreement raises a broader question than why IT disappointed: what would any technology have to do to match the special century?
Gordon's headwinds

Independent of the innovation question, Gordon identifies four structural drags suppressing growth: rising inequality concentrating productivity gains among a narrow elite rather than raising median incomes; educational attainment plateauing after decades of expansion; demographic aging reducing the working-population share; and a rising government debt-to-GDP ratio constraining fiscal capacity. Together they would hold down growth in typical living standards even if innovation picked up. The technological question is whether productivity can accelerate at all.
The 1996–2004 surge
Between 1996 and 2004, the slowdown appeared to reverse: nonfarm business output per hour grew at roughly 3% a year, matching the pre-1970 pace. IT optimists cite this as proof that technology can drive growth, and they are right about that. The open question is which technology drove the gains, and through which sectors.
The acceleration was concentrated in a handful of sectors: in 1995–2000, six of 59 sectors, led by wholesale and retail trade, semiconductors and computer manufacturing, accounted for almost all of it. Two mechanisms stand out. One was semiconductor manufacturing, where Moore’s Law drove rapid, continuous price deflation in computing hardware, making each unit of computing power cheaper at a rate that directly inflated measured output per hour in the semiconductor sector. The other was logistics in wholesale and retail. Walmart’s inventory management revolution, built on barcode scanning, electronic data interchange and real-time supply chain coordination, produced large measured efficiency gains in distribution, and competitors spent the following years copying them. The consumer internet of websites, e-commerce and email contributed, but substantially less than hardware and logistics.
The surge ended around 2004. Measured semiconductor price declines slowed sharply in the official statistics, partly because Intel changed how it priced its chips. The chips themselves kept improving fast; the official price statistics caught only a fraction of it. The IT-producing sector stopped adding much to measured growth.
Then came Facebook in 2004, YouTube in 2005 and the iPhone in 2007. Cloud computing scaled through the late 2000s, broadband spread, and social media spread through daily life. Visible technological change accelerated sharply just as measured productivity growth fell back, and the two have gone separate ways ever since.
The dynamo problem
That split gives a way to judge AI. Is it the semiconductor, structurally transformative in ways that show up in output, or the consumer internet, impressive and dominant but economically marginal? The strongest case for an AI-driven recovery is the one that specifies exactly what conditions must be met.
The economic historian Paul David found the pattern in electricity. The first central power stations opened in the early 1880s, but electric drive spread through US factories slowly, and manufacturing productivity did not accelerate until the 1920s, roughly forty years later. Factory managers who replaced steam engines with dynamos had kept the existing physical layout: one central power source driving machines through shafts and belts. The efficiency gains of individual electric motors were largely wasted because the factory was organized around the constraints of mechanical power delivery.
The breakthrough came as old mills wore out and new plants, many of them built in the investment boom of the 1920s, were designed from scratch around unit-drive systems, with an individual motor on each machine. That allowed single-storey floor plans that followed the flow of materials and labour, with production sequences arranged by logic rather than by proximity to a power shaft. That reorganization, more than the motors on their own, delivered the productivity surge of the 1920s.
Economists call the modern version the productivity J-curve: general-purpose technologies require large complementary intangible investments, such as workflow redesign, workforce retraining and organizational restructuring, before productivity gains materialize, and that investment phase depresses measured TFP before the gains appear. For AI, the question is whether firms are still running new motors off the old line shaft, dropping AI into unchanged workflows, or have begun to build new organizations around it.
At the level of single tasks, the evidence is strong. Among more than 5,000 customer support agents at one company, access to an AI tool increased issues resolved per hour by about 15% on average, with much larger gains for novice workers. Developers with GitHub Copilot completed a standard coding task about 56% faster than a control group.
Whether those gains add up across the economy is a separate question. A 15% gain at one company’s support desk, or a 56% speedup on a controlled coding task, does not move GDP by itself. To reverse the stagnation, the time saved has to turn into more output from the same hours, or the same output from fewer paid hours, across the economy.
That translation depends on where the bottleneck sits. Saving a developer hours each week raises firm-level output only if developer time is what holds the firm back. If product decisions, testing infrastructure or deployment pipelines set the pace, the saving disappears into slack: longer lunches and slower afternoons on the same paid hours, which no statistic records as productivity. The same logic applies to every sector: a faster insurance claim reviewer produces more output only if review capacity was the bottleneck, not the flow of claims or regulatory approval. A faster legal researcher produces more billable work only if the firm bills for speed rather than hours. The dynamo analogy says what to look for: firms organized differently around the technology.
General-purpose technologies

The standard definition of a general-purpose technology has three criteria: pervasiveness across sectors, continuous technical improvement, and the spawning of complementary innovations. Steam, electricity and computing all qualify. Whether current AI meets all three, or only the first two, remains open. Pervasiveness is evident and technical improvement is rapid. The open question is the third: whether improvements in AI raise the productivity of innovation in the sectors that use it, spawning new processes and products built on it. Evidence of that remains anecdotal rather than systematic.
What the evidence shows
The evidence so far comes in three kinds, and they do not point the same way.
The hardest numbers are the official ones. US labour productivity growth has stayed respectable since its cyclical rebound in 2024, while total factor productivity growth in the private nonfarm business sector slowed to 0.8% in 2025 from 1.5% in 2024. No aggregate data series through mid-2026 shows a structural break consistent with economy-wide AI-driven acceleration.
Surveys of workers are more encouraging. Late in 2024, the time AI users said they saved added up to 1.4% of all hours across the workforce, enough to raise aggregate productivity by about 1.1% if the saved time became additional output rather than absorbed slack. By the summer of 2025 more than a third of US workers used generative AI on the job, a faster uptake than the personal computer managed at the same point in its spread, and it accounted for 5.7% of all US work hours.
Time saved and time spent are different measures, and neither directly measures output. The economists running those surveys do see early hints in the aggregate numbers: between ChatGPT’s release and mid-2025, cumulative productivity growth ran about 1.9 percentage points above its prepandemic trend, and industries that reported larger time savings tended to grow faster than their trend. They stress that the link cannot be read as causal, and the official statistics through mid-2026 have not established an AI-driven structural break.
Forecasts are the least certain. The Penn Wharton Budget Model estimates AI’s contribution to TFP growth at about 0.01 percentage points in 2025, minimal because most firms have yet to deploy AI tools at scale. It projects the contribution climbing through the late 2020s and peaking in the early 2030s, but these are model outputs under specific assumptions, not observations.
Two readings fit this pattern. One is the J-curve: the cost of implementing AI and reorganizing around it holds productivity down for a while, as electrification did, and the payoff comes later. The other is that the freed time is absorbed as slack, so the technology helps individual workers while the economy never turns their savings into production.
The data cannot yet tell them apart. Workers finishing tasks faster and survey respondents reporting time savings will not settle it, because both would appear in the optimistic case, a J-curve before the breakout, and in the pessimistic one, where task-level gains never add up.
The electrification story says what “working” would look like. TFP gains would be sustained in sectors where AI adoption is three or more years mature. Productivity improvements would hold across several phases of the business cycle rather than reflecting cyclical variation. And firms would redesign work, teams and products around AI at scale, instead of layering tools over unchanged structures. In the dynamo’s terms, firms would be building the single-storey factory instead of bolting the electric motor onto the existing shaft. Case studies of firms doing this are multiplying, but they remain individual examples, and the economy-wide pattern has not appeared.
The loop
The special century never posed Solow’s puzzle. It remade daily economic life so thoroughly that a time traveller from 1870 would not recognize 1940, and nobody needed sophisticated measurement to see it. Computers raised the puzzle, and AI has raised it again.
For AI to break the loop, firms would have to do what factory builders did in the 1920s: rebuild around the technology and drop whole categories of work instead of doing existing work slightly faster. When that kind of reorganization has happened, in the special century and again in the 1996–2004 surge, it showed up plainly in the numbers. If AI’s turn comes, nobody will need to quote Solow.
Related articles
- Post-war economic development of Japan
- Who carries the debt behind the AI boom?
- Who pays for the grid that data centres need?
Further reading
As an Amazon Associate, Eikleaf earns from qualifying purchases. The book links below are affiliate links: if you buy through them, we may earn a small commission at no extra cost to you.
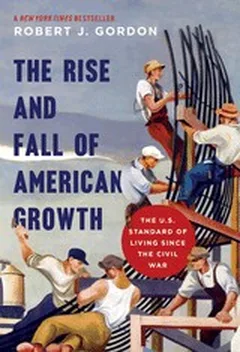 The Rise and Fall of American Growth: The U.S. Standard of Living Since the Civil WarShows how electricity, sanitation, transport and household inventions transformed productivity, and why later innovations delivered smaller gains.Growth: A History and a ReckoningGrowth: A History and a ReckoningExplains the sources of economic growth, the recent slowdown and proposals for generating new ideas while weighing growth’s wider costs.
 How Progress Ends: Technology, Innovation, and the Fate of NationsUses historical cases of innovation and stagnation to explain why institutions must adapt before technological advances sustain economic growth.
 Power and Prediction: The Disruptive Economics of Artificial IntelligenceExplains through business examples why AI’s larger benefits require redesigning interconnected decisions and workflows, matching the article’s reorganization argument.
Recommended videos
 12:14Robert Gordon: The death of innovation, the end of growthRobert Gordon’s pessimist case: the great inventions are behind us and growth is slowing for good.
 12:38Robert Gordon, Erik Brynjolfsson debate the future of work at TED2013Gordon and Brynjolfsson debate whether digital technology will revive productivity, the article’s core question.
 25:43Tyler Cowen: The Great StagnationTyler Cowen on the ‘low-hanging fruit’ thesis that gave the Great Stagnation its name.
Cite this article
Lena Martin. “The Great Stagnation: why productivity growth slowed and whether it can recover.” Eikleaf, 10 May 2026, updated 2 November 2026. https://www.eikleaf.com/the-great-stagnation-why-productivity-growth-slowed-and-whether-it-can-recover/
Gen AI Disclaimer
Some contents of this page were generated and/or edited with the help of a Generative AI.
Media
Key Sources and References
Robert Solow, “We’d Better Watch Out,” New York Times Book Review, July 12, 1987, p. 36.
Erin Henry, Pierre-Daniel Sarte, and Jack Taylor, “The Productivity Puzzle: AI, Technology Adoption and the Workforce,” Federal Reserve Bank of Richmond Economic Brief No. 24-25, August 2024. https://www.richmondfed.org/publications/research/economic_brief/2024/eb_24-25
Sasha Rogelberg, “Thousands of CEOs admit AI had no impact on employment or productivity—and it has economists resurrecting a paradox from 40 years ago,” Fortune, February 17, 2026. https://fortune.com/2026/02/17/ai-productivity-paradox-ceo-study-robert-solow-information-technology-age/
Robert J. Gordon, The Rise and Fall of American Growth: The U.S. Standard of Living Since the Civil War, Princeton University Press, 2016.
Tyler Cowen, The Great Stagnation: How America Ate All the Low-Hanging Fruit of Modern History, Got Sick, and Will (Eventually) Feel Better, Dutton/Penguin, 2011.
U.S. Bureau of Labor Statistics, Productivity and Costs news releases, 2024–2026, including “Total Factor Productivity — 2025” (March 19, 2026) and “Productivity and Costs, Second Quarter 2026, Revised” (September 3, 2026). https://www.bls.gov/productivity/ · https://www.bls.gov/news.release/prod3.nr0.htm · https://www.bls.gov/news.release/prod2.nr0.htm
OECD, Compendium of Productivity Indicators 2026, June 2026. https://www.oecd.org/en/publications/2026/06/oecd-compendium-of-productivity-indicators-2026_04e21c23.html
Erik Brynjolfsson, Avinash Collis, W. Erwin Diewert, Felix Eggers, and Kevin J. Fox, “GDP-B: Accounting for the Value of New and Free Goods in the Digital Economy,” NBER Working Paper 25695, 2019. https://www.nber.org/papers/w25695
Chad Syverson, “Challenges to Mismeasurement Explanations for the US Productivity Slowdown,” Journal of Economic Perspectives, vol. 31, no. 2, Spring 2017, pp. 165–186. https://www.aeaweb.org/articles?id=10.1257/jep.31.2.165 · https://www.nber.org/system/files/working_papers/w21974/w21974.pdf
Paul A. David, “The Dynamo and the Computer: An Historical Perspective on the Modern Productivity Paradox,” American Economic Review: Papers and Proceedings, vol. 80, no. 2, May 1990, pp. 355–361.
Erik Brynjolfsson, Daniel Rock, and Chad Syverson, “The Productivity J-Curve: How Intangibles Complement General Purpose Technologies,” American Economic Journal: Macroeconomics, vol. 13, no. 1, January 2021, pp. 333–372. https://www.aeaweb.org/articles?id=10.1257/mac.20180386
Erik Brynjolfsson, Danielle Li, and Lindsey Raymond, “Generative AI at Work,” Quarterly Journal of Economics, vol. 140, no. 2, 2025, pp. 889–942. https://academic.oup.com/qje/article/140/2/889/7990658
Sida Peng, Eirini Kalliamvakou, Peter Cihon, and Mert Demirer, “The Impact of AI on Developer Productivity: Evidence from GitHub Copilot,” arXiv:2302.06590, February 2023. https://arxiv.org/abs/2302.06590
Alexander Bick, Adam Blandin, and David Deming, “The Impact of Generative AI on Work Productivity,” Federal Reserve Bank of St. Louis, On the Economy blog, February 27, 2025. https://www.stlouisfed.org/on-the-economy/2025/feb/impact-generative-ai-work-productivity
Alexander Bick, Adam Blandin, and David Deming, “The State of Generative AI Adoption in 2025,” Federal Reserve Bank of St. Louis, On the Economy blog, November 13, 2025. https://www.stlouisfed.org/on-the-economy/2025/nov/state-generative-ai-adoption-2025
Penn Wharton Budget Model, “The Projected Impact of Generative AI on Future Productivity Growth,” September 8, 2025. https://budgetmodel.wharton.upenn.edu/issues/2025/9/8/projected-impact-of-generative-ai-on-future-productivity-growth
Congressional Budget Office, “Labor Productivity: Developments Since 1995,” March 2007. https://www.cbo.gov/sites/default/files/110th-congress-2007-2008/reports/03-26-labor.pdf
Timothy F. Bresnahan and M. Trajtenberg, “General Purpose Technologies: ‘Engines of Growth’?” Journal of Econometrics, vol. 65, no. 1, January 1995, pp. 83–108. https://doi.org/10.1016/0304-4076(94)01598-T
Robert J. Gordon, “Off Its Pinnacle,” Finance & Development, IMF, vol. 53, no. 2, June 2016. https://www.imf.org/external/pubs/ft/fandd/2016/06/gordon.htm
“The Great Stagnation: Why Hasn’t Recent Technology Created More Jobs?” (interview with Tyler Cowen), PBS NewsHour, 2011. https://www.pbs.org/newshour/show/the-great-stagnation-why-hasn-t-recent-technology-created-more-jobs
Jeremy Greenwood, Ananth Seshadri, and Mehmet Yorukoglu, “Engines of Liberation,” Review of Economic Studies, vol. 72, no. 1, 2005, pp. 109–133. https://users.ssc.wisc.edu/~aseshadr/Publications/engines.pdf
Brink Lindsey, “Not So Stagnant,” Reason, April 15, 2011. https://reason.com/2011/04/15/not-so-stagnant/
Shawn Sprague, “Contributions to labor productivity growth, private nonfarm business, 1948–2018,” Monthly Labor Review, U.S. Bureau of Labor Statistics, 2021. https://www.bls.gov/opub/mlr/2021/highcharts/data/sprague-fig2.stm
McKinsey Global Institute, “US Productivity Growth 1995–2000,” October 2001. https://www.mckinsey.com/featured-insights/americas/us-productivity-growth-1995-2000
David M. Byrne, Stephen D. Oliner, and Daniel E. Sichel, “How Fast Are Semiconductor Prices Falling?” NBER Working Paper 21074, 2015. https://www.nber.org/papers/w21074
National Park Service, “About the Homestead Act,” Homestead National Historical Park. https://www.nps.gov/home/learn/historyculture/abouthomesteadactlaw.htm