Last updated: · 14 min read
In brief
Lagos grew from about 325,000 people in 1950 to around 17 million today, and one projection puts it at 88 million by 2100. Growth like that usually means a boom, as in Shenzhen or Chicago. Not here. Sub-Saharan Africa’s cities are swelling because of demography: fertility above four children per woman, and small farms that cannot absorb the young. With about half of urban residents in informal settlements and most workers informal, the taxes that pay for pipes and drains cannot work. The cities are being built anyway, by the people arriving in them.
Contents
In 1950, Lagos had roughly 325,000 people, about the size of Atlanta at the time. A mid-century port city on the West African coast, colonial still, unremarkable in global terms. By 2025, depending on where you draw the boundary, it has somewhere between 13 and 22 million. One projection, built by extending the UN’s own growth trends, puts it at 88 million by the end of this century. If that materializes, Lagos will be the largest city in the history of human civilization.
The first reaction is economic. Fast-growing cities mean booming economies — Shenzhen, Bangalore, Houston. The growth produces the wealth, the wealth produces the infrastructure, the infrastructure absorbs more people. That is the pattern most readers carry, and it does not fit here.
Lagos, Kinshasa, Dar es Salaam and well over a hundred more fast-growing cities across Sub-Saharan Africa are driven by demography rather than an economic boom. That distinction explains why so many of the world’s fastest-growing cities are concentrated in this one region.
The Scale
Lagos went from roughly 325,000 in 1950 to about 17 million in 2025 on the UN’s 2018 estimates, a more than 50-fold increase in one lifetime. The percentage growth rate has eased, from 7–10 percent a year in the 1950s to about 3.5 percent today, but the base is now so large that every five-year period since the mid-1990s has added more people than the one before: roughly 2.1 million between 2015 and 2020, and roughly 2.8 million between 2020 and 2025 alone.
Kinshasa, the capital of the Democratic Republic of Congo, sits at roughly 17.8 million people on the UN’s 2018 projections and is growing at about 4.3% a year. In people, that means around 765,000 new residents a year, more than three-quarters of the entire population of Amsterdam, arriving permanently and needing housing, water, food, sanitation, and some kind of economic activity that does not yet formally exist for most of them. Dar es Salaam, Tanzania’s commercial capital, has about 8.6 million people and is growing at nearly 5% a year, on a trajectory to cross 10 million before 2030. Luanda, the Angolan capital, stands at roughly 10 million.
These are not outliers within the region. Roughly 400 cities worldwide grew faster than 4% a year between 2015 and 2025, one-third of them in Sub-Saharan Africa, the largest share of any region. Among big cities the pattern is starker: only three of those fast growers had more than 5 million people in 2025, and two of them, Luanda and Dar es Salaam, are in Sub-Saharan Africa.
The Hoornweg & Pope projections

Daniel Hoornweg and Kevin Pope put the 2100 figures at about 88 million people for Lagos, 84 million for Kinshasa and 74 million for Dar es Salaam. They extend the UN's own urban-growth projections beyond 2050, which is one of four methods in the paper; its alternative socioeconomic scenarios put Lagos anywhere from about 61 million to 100 million by 2100. SSA's fertility decline is accelerating faster than many 2010s models assumed, and the projections leave out the feedback loop by which urbanization itself tends to suppress fertility. The numbers are a credible trend-continuation scenario, not a consensus forecast: they show where current trends lead if they persist, without predicting that they will. Even if the real figures land at half this scale, the argument about demographic pressure, informal urbanism and fiscal incapacity still holds.
Shenzhen, China’s manufacturing metropolis, had about 314,000 residents across its municipal territory when it became a Special Economic Zone in 1980, and 17.6 million at the 2020 census — a transformation of comparable visual drama. Chicago in its fastest decades grew by more than 10% a year, from about 4,500 people in 1840 to nearly 300,000 in 1870. Both cases were spectacular, and each had an engine behind it.
Shenzhen’s growth was the product of deliberate industrial policy: the state designated it China’s first Special Economic Zone, built infrastructure ahead of population, and directed export manufacturing into it; people came because its factories needed workers. Chicago’s explosive decades rode the expansion of the railroads and the grain trade, and from 1865 the vast Union Stock Yard: every person who arrived had somewhere to go that paid them, because an industrializing economy was generating demand for labor faster than it could be supplied.
What is happening in Sub-Saharan Africa’s fastest-growing cities works by a different mechanism. There is no equivalent industrial engine or policy push toward labor-absorbing manufacturing, and no state building infrastructure ahead of the population wave. Demographic pressure is pushing people in, and cities are where people go when there is nowhere else.
The Demographic Engine
Sub-Saharan Africa’s total fertility rate in 2024 was 4.26. The global replacement rate is 2.1, the level at which, over time, a population neither grows nor shrinks, so SSA’s average is more than double it. Nigeria’s TFR was 4.8 in 2023–24 — 5.6 in rural areas, 3.9 in cities. The DRC’s is about 6.
Those figures set Sub-Saharan Africa apart. Every other major world region, from East Asia and South Asia to Latin America and the Middle East, has either completed the demographic transition or is far along in it. South Korea’s TFR was 0.80 in 2025, still the lowest in the world. Brazil is below replacement. Even India crossed below 2.1 in recent years. Sub-Saharan Africa is in the same transition, later and slower: taken as a whole, it is the only major world region still far above replacement.
A high TFR produces a young, rapidly growing population, with more children than adults and more adults tomorrow than today. In SSA, the rural economies that this population is born into are predominantly smallholder agricultural, with limited capacity for productivity growth under land pressure. They cannot absorb additional labor at the rates being generated, so young people move, and they move to cities. Formal employment is not waiting for them there, and factories, offices and service industries are not hiring at scale; what cities offer is density, proximity, informal economic possibility and networks that rural areas cannot provide. The migration is rational: with no economic boom to join, the city remains the place with the best available odds.
Compare this with the 19th-century factory pull that underpins most Western intuitions about urbanization. Manchester, Chicago: people moved to these cities because the industrial economy was generating more formal employment than existed rural workers to fill it. In SSA today, the relationship is inverted: the population is growing faster than any economy is generating demand for labor, formal or informal. The city keeps growing whether or not it is ready to receive people, because it has no mechanism to refuse them.
The pattern is common to Lagos, Kinshasa, Dar es Salaam, and dozens of smaller SSA cities, but its character varies. Kinshasa’s growth is overwhelmingly home-grown: natural increase does most of the work; the city’s transport planners put migration from the provinces, some of it driven by insecurity, at roughly one percentage point a year, while in October 2023 about four in five of the roughly 6.9 million Congolese displaced inside the country were in the eastern provinces. Luanda’s expansion was shaped first by Angola’s civil war, which drove rural Angolans into the capital, and then by the oil revenues that funded the post-2002 construction boom. Local factors like these add to the demographic pressure or alter its character in specific cases; they do not replace it.
The aggregate consequence: SSA’s urban population is projected to grow from about 575 million in 2025 to about 1.26 billion by 2050, more than doubling in 25 years. For the whole continent, all 54 African countries, the figure is closer to 1.4 billion. Much of that trajectory is already built into the age structure of SSA’s population, so even a faster fertility decline would trim it rather than reverse it.
The fertility decline debate

Some demographers argue SSA's fertility is declining faster than standard models project: female education uptake is accelerating, contraceptive adoption is increasing in parts of West Africa, and urbanization itself tends to suppress fertility. Modeled by female education group, Africa's fertility falls faster under high-education scenarios, which means the highest-end population projections, including Hoornweg and Pope's 2100 figures, are likely overestimates. But the demographic math for the next 25 years is far less sensitive to which fertility trajectory materializes from here. The children, adolescents and young adults who will move to cities between now and 2050 belong to the population already born and counted, and population momentum carries much of the growth forward whatever fertility does next. On the UN's projections, SSA's urban population roughly doubles by 2050; a faster fertility decline would trim that figure, but it reshapes the century's second half far more than its first.
What the City Is
The city most people picture when they hear about millions of people arriving annually has streets, buildings with addresses, pipes that bring water. It has a municipal government that issues permits, collects rubbish and installs streetlights, and a formal labor market, or at least an informal one operating in the shadow of a formal one.
About half of Sub-Saharan Africa’s urban population, 49 percent in 2024, lives in slums or informal settlements: areas with no legal land tenure, no registered addresses, and limited or no connection to piped water, electricity or sewage systems. Approximately 238 million people in SSA were living in slum conditions in 2018.
When every street block in the region is mapped from high-resolution satellite data on building footprints, about 550 million people in Sub-Saharan Africa turn out to live in street blocks so tangled that many buildings have no street access at all, a layout that makes official addresses, piped connections, and access for a fire engine or ambulance hard to provide. Three-quarters of them are rural; on average, the region’s cities do better than its countryside. But no city in the region has closed the gap. Some, like Antananarivo in Madagascar, remain mostly informal, and even Lagos, one of the better-connected, leaves up to a third of its residents in poorly accessed blocks.
The informal economy follows the same logic. The World Bank estimates that 56–65% of SSA’s urban workers are informal, with no contract, no registration, no payroll taxes and no social protections. When the two countries with the largest urban populations, Nigeria and South Africa, are excluded, the figure rises to about 70%, and broader definitions push the share higher still. In most of these cities, then, informal work is the main economy, and calling it the informal sector, as if it sat on the fringe of some larger formal one, misleads.
The street markets, small-scale manufacturers, transport operators, mobile money agents and urban farmers are the primary economic institution of urban life in the region. They generate income, allocate resources, discipline prices, and perform social functions that formal markets perform elsewhere.
Dar es Salaam makes the urban agriculture point with particular clarity. About 47% of food products in surveyed local markets come from urban and peri-urban agriculture. For vegetables the share runs higher: urban and peri-urban farms supply 60–80% of the vegetables sold in surveyed supermarkets, and 70% of the amaranth eaten in the city, a staple green leafy vegetable, is grown within it. Farming on this scale is a functional adaptation to the absence of reliable cold-chain logistics and formal distribution networks. The city feeds itself through a food system the formal economy did not build and formal planners did not design.
Informal settlement means inadequate sanitation, elevated disease burden, vulnerability to fire and flood, absence of the legal protections that formal tenure provides. Informal employment means no safety net, no sick leave, no pension, extreme volatility. Urban farming works, but it also carries risks: contaminated soil, water scarcity, land insecurity. None of these systems is fine, but they are the ones that exist. They emerged because formal alternatives were never built at the required scale, and in the absence of anything else they work, imperfectly, unequally and at a human cost. The world has few tools to evaluate them, because the tools of urban analysis were built for cities with addresses, payrolls and permits.
The Governance Gap
Governing these cities starts with money, and most SSA city governments depend on transfers from central government: funding that is politically determined, inconsistently disbursed and not indexed to the pace of urban growth. A city growing at 4–5% a year cannot wait for a government budget cycle to catch up.
The UN Economic Commission for Africa assessed six target cities in its municipal-finance programme, among them Addis Ababa, Kigali and Lusaka, and judged them to be functioning below 40% of their economic capacity. The remedy the ECA points to is local revenue: cities that tap their own economic base can cut their dependence on central transfers.
More than five years after the Lagos Water Supply Masterplan expired in 2020, Lagos Water Corporation’s installed capacity is still just under 210 million gallons a day. The Masterplan put the city’s 2025 demand at around 780 million gallons a day. Government pipelines reach barely 35% of Lagos’s population, and far fewer get a reliable supply: around 5% of residents have pipe-borne water, leaving 90–95% of Lagosians, well over ten million people, dependent on boreholes, wells, tanker trucks or sachet water sold from carts. Each of these costs more per unit than piped water. Across urban Sub-Saharan Africa, water-rights campaigners estimate that low-income households buying from vendors pay 10 to 20 times more per unit than wealthier households on the network. In Lagos, as in most cities where formal infrastructure covers less than half the population, the poorest pay the most.
In 2024, Lagos was the epicenter of Nigeria’s cholera outbreak. By late July, Nigeria had recorded about 4,800 suspected cases and 156 deaths, and Lagos accounted for 65% of all suspected cases reported nationally that year. Cholera is a waterborne disease, and its concentration in Lagos tracks the city’s water and sanitation gap.
Kinshasa’s situation is structurally comparable. Approximately 52% of the DRC’s population has access to an improved water source and 29% to improved sanitation. The city’s water utility, REGIDESO, runs supply infrastructure that has struggled for decades to keep pace with the city’s growth. Energy tells the same story: 95% of surveyed Kinshasa households used charcoal for cooking, in a megacity of well over 14 million people.
The cause of these gaps runs deeper than a shortage of money for projects: it is built into the way these cities raise money at all. The primary fiscal mechanisms for urban infrastructure investment, such as property taxes, formal-economy income taxes, development fees and bonds backed by future revenue streams, all presuppose a substantial formal economy and a formal property market. Property taxes require properties that are registered, assessed and legally owned; income taxes require income that flows through traceable formal employment; development fees require construction that goes through permitted processes. When most employment is informal and most residential settlement is unregistered, these fiscal instruments do not function. Incompetence and corruption occur, but the deeper problem is that the instruments themselves presuppose a city structure that does not exist.
More aid patches specific shortfalls. It can pay for a water treatment plant or a section of new pipe, or a course for municipal planners. It cannot rebuild the fiscal architecture, because that architecture’s dysfunction comes from how this city formed in the first place: fast and informally, under demographic pressure. The governance instruments available to the city that emerged were never designed for it.
What This Means for the Century
By 2050, less than 25 years from now, Sub-Saharan Africa’s urban population will reach approximately 1.26 billion. Within a single generation, roughly two of every five people added to the world’s urban population will be added in Sub-Saharan Africa — in cities and towns largely built on informal settlement, governed by municipalities that cannot raise revenue at the pace of growth, and organized primarily around informal economic relationships.
The governance infrastructure required to deliver what urban civilization is assumed to provide, from epidemic response and mass education to piped water and climate adaptation, rests on one shared substrate that cannot be delivered program by program: a government that knows who lives where, can tax what they earn, and can borrow against what it will collect. That substrate requires registered addresses, traceable income and permitted construction, which is to say the other kind of city. None of it has been built here, and none of it is being built at anywhere near the pace required.
Mobile money has transformed informal financial systems across East Africa. In Kenya, mobile money penetration reached 98% by the end of December 2025, counted in subscriptions, so some people hold more than one. Safaricom’s M-Pesa held about 89% of subscriptions. Community-level water systems in Lagos’s peri-urban areas reach where the LWC cannot. Urban food systems in Dar es Salaam function at city scale. None of this is trivial, but none of it scales to the epidemic response, the education, the drainage and the climate adaptation that a city of 30 or 50 million requires. The failure modes, when dense informal settlement meets epidemic disease or flood, are severe and not buffered by a government with the capacity to respond.
What we call urban civilization carries assumptions about what a city can and should provide, what governance capacity it requires and what scale of infrastructure it depends on. Those assumptions were built on one mode of urban growth: economically driven, institutionally formal, and supported by states with the fiscal capacity and planning apparatus to anticipate growth rather than perpetually chase it. That mode produced the cities most people in wealthy countries live in, and the conceptual frameworks used to evaluate every other city in the world. The mode now setting the pace of this century’s urban growth is demographically driven and informal, and at its scale it is a norm of its own.
The Durable Condition
Lagos went from 325,000 to 17 million in one human lifetime. Few cities in history have grown like that without an industrial economy pulling people in, or a state with capacity to build ahead of them.
More infrastructure investment would help, and no one disputes it. The harder question is what the world looks like when the region whose cities and towns will absorb roughly two of every five new urban dwellers on Earth between now and 2050 is the one the world’s institutional architecture is least equipped to manage, and when nothing in view suggests that condition will pass.
The city is being built anyway, by the people arriving in it, through street markets, urban farms and mobile money that no planner designed.
Related articles
- Why cities don’t work the way their planners intended — and why the best ones were never planned at all
- Why desalination hasn’t solved the water crisis — and what actually would
- Why landlocked countries are systematically poorer — and the exceptions that prove the rule
Further reading
As an Amazon Associate, Eikleaf earns from qualifying purchases. The book links below are affiliate links: if you buy through them, we may earn a small commission at no extra cost to you.
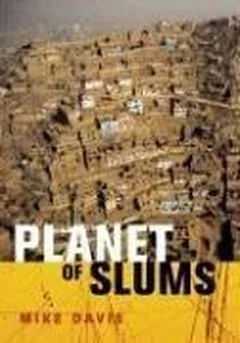 Planet of SlumsExamines why cities can expand without corresponding formal employment, housing or sanitation, including examples from Lagos and Kinshasa.
 Metropolis: A History of the City, Humankind’s Greatest InventionPlaces contemporary Lagos alongside industrial Manchester and Chicago in a global history of how cities grow and organise economic life.
 Africa Is Not a Country: Notes on a Bright ContinentCombines an account of life in Lagos with national histories and political context that help readers distinguish the countries behind the regional urban-growth statistics.
Recommended videos
 24:55Africa’s future megacities: What will Lagos be like in 2100? | DW NewsDW report on Lagos and Africa’s coming megacities: growth without matching jobs or infrastructure.
 7:42Overpopulation & AfricaExplains the demographic transition behind Africa’s population growth, the engine of its urban boom.
 5:05Is Africa ready for its population boom? | CNBC ExplainsShort explainer on whether African economies can absorb a fast-growing urban population.
Cite this article
Lena Martin. “Why so many of the world’s fastest-growing cities are in one region.” Eikleaf, 12 May 2026, updated 2 November 2026. https://www.eikleaf.com/why-the-fastest-growing-cities-in-the-world-are-almost-all-in-one-region/
Gen AI Disclaimer
Some contents of this page were generated and/or edited with the help of a Generative AI.
Media
Key Sources and References
UN Population Division. World Urbanization Prospects 2025: Summary of Results (incl. Table A3, urban population by region; p. 26, fastest-growing cities). UN DESA, 2025. https://population.un.org/wup/assets/Publications/undesa_pd_2025_wup2025_summary_of_results_final.pdf
UN Population Division. World Urbanization Prospects: The 2018 Revision, File 12 (urban agglomerations) and File 14 (growth rates). UN DESA, 2018. https://population.un.org/wup/assets/Download/Archive/WUP2018-Excel-files.zip · https://population.un.org/wup/
Hoornweg, D. & Pope, K. “Socioeconomic Pathways and Regional Distribution of the World’s 101 Largest Cities.” Global Cities Institute Working Paper No. 4, January 2014; and “Population predictions for the world’s largest cities in the 21st century.” Environment and Urbanization, vol. 29, no. 1, pp. 195–216, 2017. doi: 10.1177/0956247816663557 https://shared.ontariotechu.ca/shared/faculty-sites/sustainability-today/publications/population-predictions-of-the-101-largest-cities-in-the-21st-century.pdf · https://doi.org/10.1177/0956247816663557 · https://sites.ontariotechu.ca/sustainabilitytoday/urban-and-energy-systems/Worlds-largest-cities/population-projections/
Adhikari, S., Lutz, W. & Kebede, E. “Forecasting Africa’s fertility decline by female education groups.” Proceedings of the National Academy of Sciences, vol. 121, no. 46 (2024). doi: 10.1073/pnas.2320247121 https://doi.org/10.1073/pnas.2320247121
Bettencourt, L.M.A. & Marchio, N. “Infrastructure deficits and informal settlements in sub-Saharan Africa.” Nature, vol. 645, pp. 399–406 (2025). Interactive data: Million Neighborhoods Africa. https://www.nature.com/articles/s41586-025-09465-2 · https://millionneighborhoods.africa/
World Bank Policy Research Working Paper 10703. “Urban Informality in Sub-Saharan Africa: Profiling Workers and Firms in an Urban Context.” 2024. https://documents1.worldbank.org/curated/en/099417402142413528/pdf/IDU1e9d2d68a110ad14aaa1af9a110e90bd603f1.pdf
National Population Commission (Nigeria) & ICF. Nigeria Demographic and Health Survey 2023–24: Key Indicators Report (PR157). DHS Program, 2024. https://dhsprogram.com/pubs/pdf/PR157/PR157.pdf
World Bank Open Data. “Fertility rate, total (births per woman)” — Sub-Saharan Africa, Congo, Dem. Rep., Nigeria (2024 values). https://data.worldbank.org/indicator/SP.DYN.TFRT.IN?locations=ZG · https://api.worldbank.org/v2/country/SSF;COD;NGA/indicator/SP.DYN.TFRT.IN?format=json&date=2021:2025
Reuters (via Free Malaysia Today). “South Korea’s birthrate, the world’s lowest, rises again.” 25 February 2026. https://www.freemalaysiatoday.com/category/world/2026/02/25/south-koreas-birthrate-the-worlds-lowest-rises-again
International Labour Organization. “Women and Men in the Informal Economy: A Statistical Picture.” 3rd edition, ILO, 2018. https://www.ilo.org/sites/default/files/wcmsp5/groups/public/@dgreports/@dcomm/documents/publication/wcms_626831.pdf
United Nations. The Sustainable Development Goals Report 2019, Goal 11. https://unstats.un.org/sdgs/report/2019/The-Sustainable-Development-Goals-Report-2019.pdf
UN Statistics Division. Global SDG Indicators Database, indicator 11.1.1 (proportion of urban population living in slums, informal settlements or inadequate housing), Sub-Saharan Africa. https://unstats.un.org/sdgapi/v1/sdg/Series/Data?seriesCode=EN_LND_SLUM&areaCode=202&pageSize=50 · https://unstats.un.org/sdgs/dataportal
Wessels, M.T. & Hemerijckx, L.-M. “Going with the food flow: The contribution of urban agriculture to a growing African city.” Development Southern Africa, vol. 41, no. 6, 2024. doi: 10.1080/0376835X.2024.2398547 https://doi.org/10.1080/0376835X.2024.2398547
Malekela, A.A. & Nyomora, A. “Food security: The role of urban and peri-urban agriculture. A case of Dar es Salaam City, Tanzania.” International Journal of Agronomy and Agricultural Research, vol. 13, no. 2, pp. 50–62, 2018. https://innspub.net/food-security-the-role-of-urban-and-peri-urban-agriculture-a-case-of-dar-es-salaam-city-tanzania/
UNECA / Africa Renewal. “Unlocking municipal finance for sustainable urban services and SDG success in Africa.” Africa Renewal, 9 December 2025. https://africarenewal.un.org/en/magazine/unlocking-municipal-finance-sustainable-urban-services-and-sdg-success-africa
CAPPA. “Five years after masterplan expired, Lagos still in search of safe drinking water.” 30 August 2025; and “Poor households pay 20 times more for water, coalition raises alarm.” 13 October 2026. https://cappaafrica.org/2025/08/30/five-years-after-masterplan-expired-lagos-still-in-search-of-safe-drinking-water/ · https://cappaafrica.org/2026/10/13/poor-households-pay-20-times-more-for-water-coalition-raises-alarm/
Nigeria Centre for Disease Control and Prevention. Cholera Situation Report, Epidemiological Week 29 (July 15–21, 2024). https://ncdc.gov.ng/themes/common/files/sitreps/2c93d23eabd9ac41e2d998c311fbc997.pdf
UNICEF Democratic Republic of Congo. Water, Sanitation and Hygiene. https://www.unicef.org/drcongo/en/what-we-do/water-sanitation-and-hygiene
World Bank. “Supporting drinking water access, a key to progress in DRC.” 15 November 2023. https://www.worldbank.org/en/news/feature/2023/11/15/supporting-drinking-water-access-a-key-to-progress-in-afe-1123-democratic-republic-of-congo-drc
Belani Masamba et al. “État des lieux de l’utilisation des énergies de cuisson dans les ménages de Kinshasa.” Bois et Forêts des Tropiques, no. 355 (2023). doi: 10.19182/bft2023.355.a36853 https://revues.cirad.fr/index.php/BFT/article/view/36853
JICA. Project for Urban Transport Master Plan in Kinshasa City (PDTK), Final Report, Vol. 1. https://openjicareport.jica.go.jp/pdf/12340295_02.pdf
International Organization for Migration. “Record high displacement in DRC at nearly 7 million.” 30 October 2023. https://www.iom.int/news/record-high-displacement-drc-nearly-7-million
Human Rights Watch. “They Pushed Down the Houses: Forced Evictions and Insecure Land Tenure for Luanda’s Urban Poor,” chapter 5. 2007. https://www.hrw.org/reports/2007/angola0507/5.htm
Communications Authority of Kenya sector statistics, as reported in FinTech Magazine Africa, “Kenya’s Mobile Money Penetration Reaches 91%” (26 September 2025), and Techweez, “Kenya Adds 2.7 Million Mobile Money Users in 3 Months to Hit 98% Penetration” (7 April 2026). https://fintechmagazine.africa/2025/09/26/kenyas-mobile-money-penetration-reaches-91/ · https://techweez.com/2026/04/07/kenya-mobile-money-98-percent-penetration/
OECD/AfDB/UCLG Africa/Cities Alliance. Africa’s Urbanisation Dynamics 2025. OECD Publishing, 2025. doi: 10.1787/2a47845c-en https://doi.org/10.1787/2a47845c-en
Shenzhen Government Online. “City population stands at 17.56 million” (seventh national census), 2021; Shenzhen profile (first special economic zone, August 1980); and “Shenzhen Story”: permanent population of 314,100 at the founding of the Special Economic Zone, 19 February 2023. https://www.sz.gov.cn/en_szgov/news/latest/content/post_8771774.html · https://www.sz.gov.cn/en_szgov/aboutsz/profile/content/post_12542766.html · https://www.sz.gov.cn/szstoryjp/202302/content/post_10432011.html
US Bureau of the Census. Historical population data for Chicago, Illinois, 1840–1990 (compiled by S. Redner, Boston University); Chicago Public Library, “Technology That Changed Chicago: Union Stockyards, Part 1.” http://physics.bu.edu/~redner/projects/population/cities/chicago.html · https://www.chipublib.org/blogs/post/technology-that-changed-chicago-union-stockyards-part-one/
US Bureau of the Census. Population of the 100 Largest Cities and Other Urban Places in the United States, 1950 (Table 18), Working Paper POP-TWPS0027, 1998. https://www2.census.gov/library/working-papers/1998/demo/pop-twps0027/tab18.txt
Statistics Netherlands (CBS). StatLine 37230ned, population of Amsterdam on 1 January 2026. https://opendata.cbs.nl/ODataApi/odata/37230ned/TypedDataSet?$filter=RegioS%20eq%20’GM0363’%20and%20Perioden%20eq%20’2026MM01′