Last updated: · 18 min read
In brief
Before the war with Iran, the equivalent of about a fifth of the world’s oil consumption passed through the Strait of Hormuz. In March, Gulf exports through it fell to a tenth, yet the world never ran out. A pre-war surplus, detour pipelines, extra supply and lower demand filled most of the hole. Stocks paid for the rest. The largest offset was lower demand, and nearly 30% of that fall was China. Crude is flowing again, but diesel and cooking gas lag, stocks sit 509 million barrels down, and attacks are mounting.
Contents
In late October 2026, Sheikh Nawaf Al-Sabah, chief executive of Kuwait’s state oil producer, said his country was exporting as much crude as it had before the war with Iran began. His difficulty lay elsewhere. Kuwait needed more tankers to carry its jet fuel and diesel. On 22 October, the day his remarks were reported, Brent crude climbed 4% to settle near $113 a barrel after deadly attacks in Saudi Arabia. Yemen’s Houthis had claimed strikes on the Saudi port of Yanbu over the previous two days, and Iranian state television said seven oil tankers had caught fire or been damaged by mines overnight in the Strait of Hormuz, four of them while transferring oil. Nobody could independently confirm the Iranian claim.
The crude was back, and the price of oil was still climbing. Crude exports had recovered faster than supplies of refined fuel, and the stockpiles spent to cover the gap had not been rebuilt.
A strait closed to nearly everyone
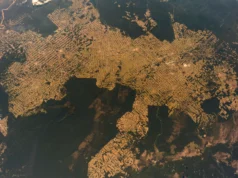
Hormuz is the narrow sea door at the mouth of the Persian Gulf, the way out for the oil of Saudi Arabia, Iraq, Kuwait, the United Arab Emirates, Qatar, Bahrain and Iran. In 2024 about 20 million barrels a day moved through it, the equivalent of roughly a fifth of the world’s oil consumption. A fifth of the world’s trade in liquefied natural gas (LNG) went the same way, most of it from Qatar. Asia was the destination for 84% of the crude and 83% of the LNG.
On 28 February 2026 the United States and Israel launched joint strikes on Iran. In March, Gulf exports passing through the strait averaged 2.3 million barrels a day, a tenth of their pre-war level, and Iran accounted for more than 70% of what got through. Iranian exports that month held at their pre-war level while every other Gulf producer suffered extreme losses. The strait had closed to almost everyone except the country closing it.
By late October the disruption had lasted almost eight months. Billions of barrels that would normally have passed through Hormuz did not, and the world still did not run out of oil.
Counting the hole
There are two ways to measure what the closure removed, and they answer different questions. The first counts exports. In August, flows through the strait were still 13.1 million barrels a day below their pre-war level, and the International Energy Agency (IEA), the rich-world energy watchdog, put the cumulative loss of exports through the waterway by the end of that month at close to 2.8 billion barrels.
The second counts production. Oil that cannot be shipped has to be stored, and the Gulf’s storage filled fast. With few ships able or willing to load and domestic tanks filling up, Gulf producers shut in wells, cutting output by at least 10 million barrels a day in March. Crude shut-ins peaked at 10.9 million barrels a day in May. By October Kpler, a data firm that tracks tankers, estimated that more than 2 billion barrels of Middle Eastern crude and condensate production had been lost since the war began, and that about 5 million barrels a day was still offline on 6 October compared with February, much of it Iranian. By late October Kpler put the shortfall in crude production at about 2.7 million barrels a day.
Against that hole, the IEA’s account names five things that filled it. They were measured over different windows, from slightly different starting points, so they rank the sources of relief rather than adding up to a neat total.
The first was a cushion that existed before anyone fired a shot. The oil market entered the war in surplus by more than 1 million barrels a day. In 2025 supply had exceeded demand by 1.4 million barrels a day on average, and by more than 2 million in the second half, and the excess went into storage, most notably in China. In January 2026 the world’s observed oil stocks stood at 8.21 billion barrels, their highest since February 2021.
The second was the detour. Saudi Arabia can pump crude across the peninsula to Yanbu on the Red Sea, and the UAE can pipe it to Fujairah, outside the strait on the Gulf of Oman. Exports from those two ports rose from 4.1 million barrels a day in February to 7.8 million in June, then fell back to 5.5 million in August after Houthi attacks in the Red Sea. Between the start of the war and August, the bypass routes offset more than 500 million barrels of lost Hormuz exports.
What a bypass pipeline can carry

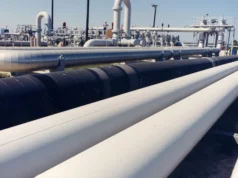
Saudi Arabia's East-West pipeline was built in the early 1980s and runs about 1,200 kilometres from the Abqaiq processing centre near the Gulf to Yanbu, entirely on Saudi soil. It is rated at 5 million barrels a day, but in 2019 Aramco converted some natural gas liquids lines to carry crude and temporarily stretched it to 7 million. In May 2026 Aramco said the line had reached that maximum. About 2 million barrels a day of that feeds refineries on the kingdom's west coast, leaving about 5 million for export. The UAE's line to Fujairah carries up to 1.8 million barrels a day. In June 2025 the US Energy Information Administration estimated that the two systems had only about 2.6 million barrels a day of unused capacity that could be turned to bypassing Hormuz in an emergency. Geography adds a second limit. The direct route from Yanbu to Asia runs south through the Bab el-Mandeb, where Houthi attacks had already disrupted oil flows in 2024. Sailing north through Suez instead can make the trip nearly three times as long. New UAE bypass capacity is not expected until 2027.
The third was everyone else. By the end of August producers outside the Gulf had added a cumulative 420 million barrels since the start of the war. Between February and August, large gains came from the United States, Brazil and Kazakhstan, each adding between 440,000 and 520,000 barrels a day.
The fourth was lower demand. From March to August, world oil demand averaged 5.8 million barrels a day less than in February, a cumulative reduction of more than a billion barrels. The IEA describes this demand response as “equally important” to the supply-side adjustments. In its accounting, lower demand was the largest single offset.
The fifth was stocks, which paid for whatever gap remained. In its September assessment the IEA estimated a deficit of 2.2 million barrels a day in the second quarter and 1.7 million in the third. That deficit is the hole left after the detours, the new supply and the lower demand had done their work, and it was met by drawing down tanks. By August observed stocks were 507 million barrels lower than at the outbreak of war. More than 300 million barrels of that came from emergency stocks, released under a collective action that IEA members agreed on 11 March, the sixth and by far the largest in the agency’s history.
Price did much of the sorting. March brought the biggest monthly rise in oil prices on record. By mid-April a barrel of North Sea crude for physical delivery traded around $130, about $60 above its pre-war level, and those spot prices outran futures as refiners scrambled to replace cargoes trapped in the Gulf. From April prices eased for a time as emergency oil was released, detours filled, other producers pumped more, some Gulf flows recovered and demand softened.
Using less, or buying less?
“Lower demand” sounds like millions of people driving less and cooking less, and some of it was exactly that. The biggest single piece, though, came from China, where demand is an estimate rather than a count of fuel delivered to users. The IEA calculates China’s apparent demand from refinery output and net imports of fuel, with adjustments.
On that measure China saw the largest drop in demand of any country. Its oil imports, refinery activity and fuel deliveries all fell well below their pre-war levels, and over the six months to August its apparent demand ran 1.7 million barrels a day below February. In the IEA’s accounting, China made up nearly 30% of the global fall in demand.
China also bought much less crude as prices surged. Its seaborne crude imports dropped from 11.5 million barrels a day in February to 6 million in June, which eased the pressure considerably on other crude importers in Asia.
It drew on its stockpile too, and the IEA counts that as a third, separate quantity, under stocks rather than under lower demand. China is estimated to have added an average of 1.1 million barrels a day to its crude inventories in 2025, bringing them to nearly 1.4 billion barrels by December, and to have kept building in early 2026, before the war. Of the 105 million barrels by which crude stocks outside the rich-country OECD fell by August, 65% came out of above-ground tanks in China. In September its onshore stocks fell at the fastest pace on Kpler’s records. Those draws came mostly from commercial stocks held by refiners and traders, while the state’s strategic reserve was left largely untouched.
Over the first nine months as a whole, the draws after the spring had not used up the barrels added earlier. From January to September, China’s crude imports and domestic output still exceeded what its refineries processed by 240,000 barrels a day.
Outside China, the IEA traces lower demand to restrictions in the Middle East, rationing and conservation orders in Asia, and shortages and high prices in other regions, while some buyers postponed purchases. It took three forms.
The first was administrative. In the Middle East, the war brought restrictions on petrochemical operations and aviation. In Asia, governments ordered people to use less. In Pakistan, the prime minister announced a four-day working week for offices on 9 March and closed all schools for two weeks, and Sindh province halved fuel for government vehicles. The Philippines and Sri Lanka introduced four-day weeks or extra public holidays, and Bangladesh brought forward university holidays.
The second was physical shortage. Some fuels simply were not there. India rationed liquefied petroleum gas (LPG), the bottled gas used for cooking, especially for commercial and industrial users, and allowed alternative cooking fuels. Asian petrochemical plants, which use naphtha, LPG and ethane as raw materials, cut runs by an amount reportedly equivalent to between 10% and 30% of their capacity. Worldwide, in the second quarter, deliveries of those three feedstocks fell by 1.8 million barrels a day from a year earlier and gasoil, the family of fuels that includes diesel and heating oil, by 1.1 million. World oil demand fell about 5 million barrels a day year on year that quarter, its first quarterly decline since the Covid pandemic.
The third was deferral. In OECD countries, deliveries of gasoil for uses other than transport, much of it heating oil, fell 8% year on year in the five months to July as households and firms put off filling their tanks. Diesel deliveries, which are harder to postpone, fell only 2%, propped up by government measures to soften prices. The heating oil not bought over the summer still has to be bought before winter.
So the largest offset in the IEA’s accounting was real for Pakistani pupils sent home and for Indian businesses whose gas was rationed, and nearly 30% of it was China’s lower apparent demand. For 2026 as a whole, the IEA expects world oil demand to fall by 2.6 million barrels a day.
Prizing the strait open
The crude came back without a peace deal, through an improvised system of permissions, blockades and workarounds.
Iran controlled access from the start. By late March it was vetting ships: the Revolutionary Guards issued an approved vessel a clearance code and a route, and an Iranian boat escorted it through Iranian waters around Larak Island. Ships from Malaysia, China, Egypt, South Korea and India were reportedly let through after talks with what Iran called “friendly” nations. An Iranian lawmaker said some vessels had been charged $2 million to pass, and Lloyd’s List reported at least two paying in Chinese yuan.
The United States added a blockade of its own. From mid-April the US Navy blocked Iran’s ports, a separate measure aimed at Iran’s exports rather than at the strait. The blockade was lifted after the two governments signed a memorandum of understanding on 17 June, which opened a 60-day window for negotiations. Crude flows nearly tripled in that window, but as Kpler put it, “The MoU moved oil; it did not restore the strait.” The US reimposed its blockade on 14 July. From mid-July to late August about five vessels a day crossed the strait, almost 95% fewer than the roughly 100 a day before the war. In October the secretary-general of the International Maritime Organization (IMO) put it plainly: “there is a double blockade”.
Traffic recovered anyway, by practice rather than by agreement. Tanker operators willing to take the risk began running oil through the strait at night, in a lane near Oman’s coast protected by the US military, with their location transponders and mobile phones switched off. Outside, in the Gulf of Oman, they passed the oil to other tankers waiting to carry it to Asia. In September Saudi Arabia increasingly used such ship-to-ship transfers along Oman’s coast. By 1 October Kpler judged that the strait was being “prized open operationally”, through escorts, night transits and transfers rather than a deal.
The mine that met the first convoy

Escorting tankers through the Gulf has been tried before. In the Iran-Iraq war, Iraq widened its attacks on shipping in 1984, and 71 merchant ships were attacked that year alone, against 48 in the war's first three years. The attacks halved Iran's oil exports, cut shipping in the Gulf by a quarter and pushed Lloyd's of London to raise tanker insurance rates, though ships kept sailing. On 7 March 1987 the Reagan administration agreed to put eleven Kuwaiti tankers under the American flag and escort them with US warships. Iran's Revolutionary Guards expected the convoys and mined the channel. On 24 July, on the first of those convoys, the reflagged tanker Bridgeton struck an Iranian M-08 contact mine near Farsi Island. The blast tore a 50-square-metre hole in its hull. The ship stayed afloat and nobody aboard was killed.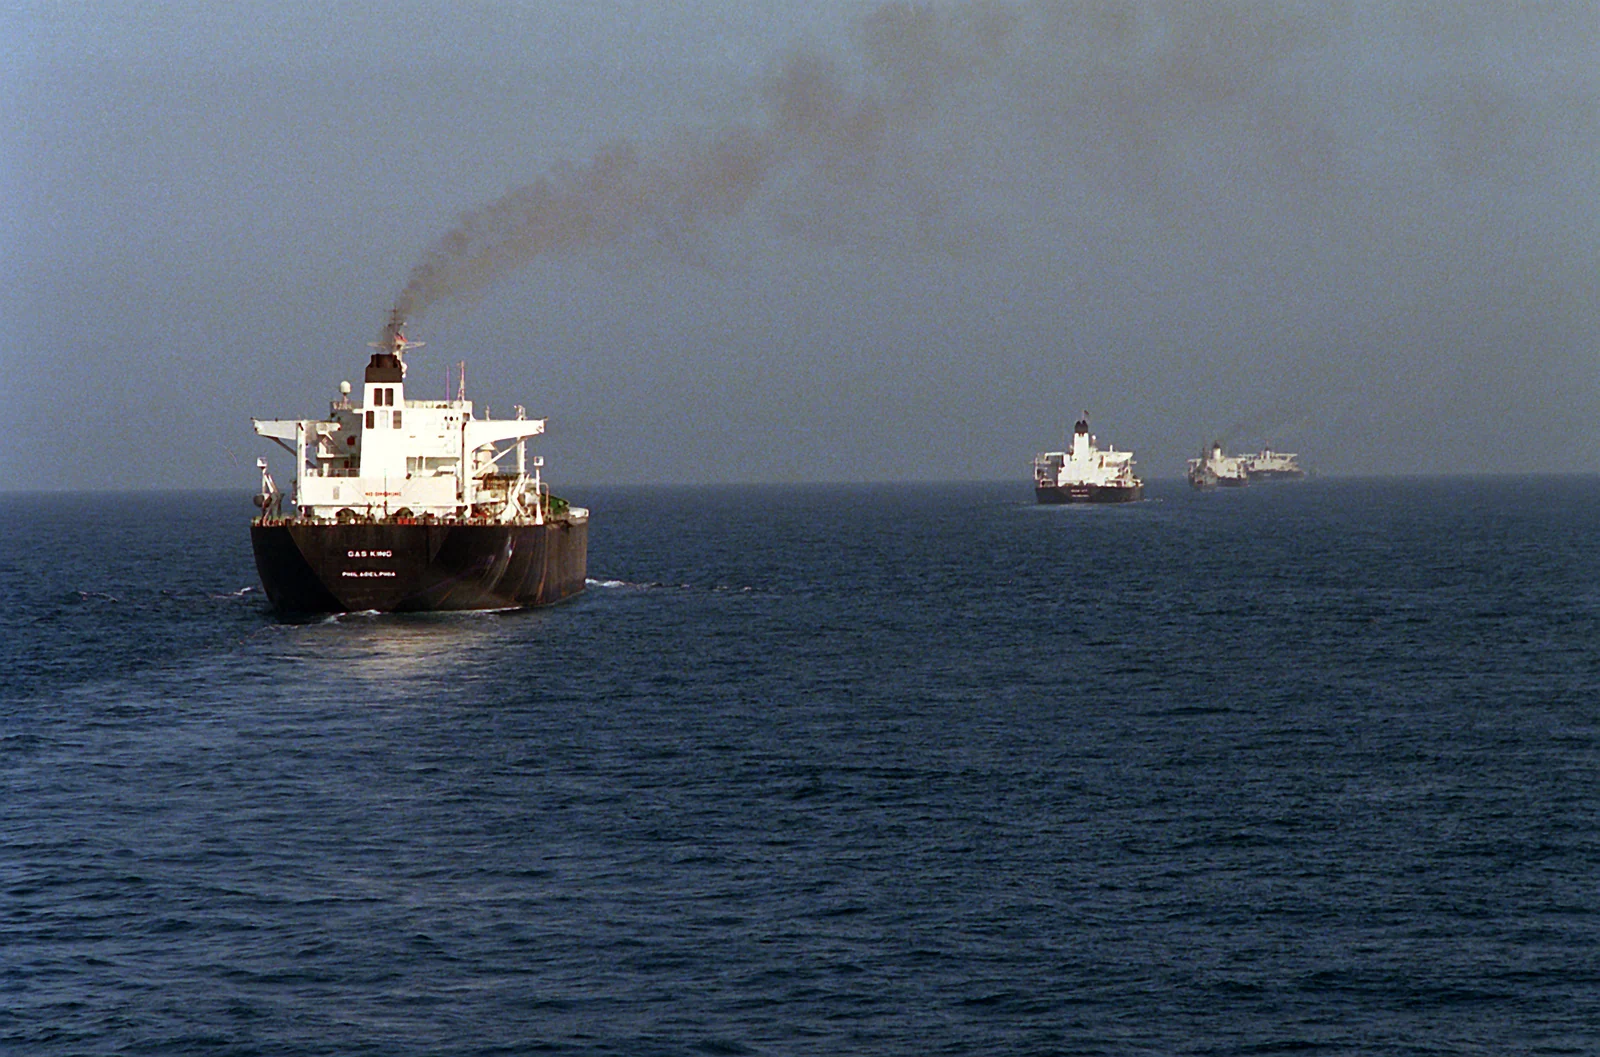
The volumes followed. In September Gulf crude exports jumped by 4.4 million barrels a day to 13.9 million, more than three-quarters of their pre-war level, as production recovered and inventories were drawn down. Total oil flows through the strait rose to 10.9 million barrels a day. Exports through the bypass routes reached 5.6 million barrels a day after the East-West pipeline, shut down after drone attacks in early September, was repaired and partly back in service by 22 September. By early October Kpler had Middle East crude exports temporarily back at pre-war levels, even with about 5 million barrels a day of production still offline. By late October crude supply from Middle East producers other than Iran was running at 16.8 million barrels a day, above their 2025 average, while Iranian oil on the water outside the US blockade zone had fallen to zero.
Buyers came back with them. India’s crude imports from the Middle East reached about 3 million barrels a day in September, back to their pre-war level. Chinese firms were estimated to have bought at least 80 million barrels of Saudi crude for loading between September and November, and China’s imports from the Middle East were on track to top 5 million barrels a day in October, against 3.5 million in September. In the week of 5 to 11 October, at least 104 vessels without Iranian links crossed the strait, 17% fewer than the week before but 31% more than the weekly average in August.
Every one of those figures depends on what is being counted. Kpler’s widest Hormuz measure, which it calls total clearance, adds confirmed crossings of the strait to the oil handed between ships in the Gulf of Oman whose loading port it cannot yet trace, and its newest daily readings are preliminary floors that usually rise as confirmations arrive. Lloyd’s List Intelligence counts only ships without Iranian links. Ships that switch off their transponders show up late, if at all. In early September US officials said 40 ships carrying some 18 million barrels had passed under US escort in a single day, a day on which Kpler counted 11 vessels. On 22 October President Trump wrote that more oil was coming through the strait than before the war. The IEA’s count for September, the most recent full month, was 10.9 million barrels a day against roughly 20 million before the war. Kpler’s preliminary total-clearance estimates swung from 28.5 million barrels a day on 18 October to 4.3 million the next.
The barrels that lag behind
Crude exports recovered faster than refined fuels. In September, the Gulf shipped 1.9 million barrels a day of refined products, against 4.7 million before the war, and 670,000 barrels a day of LPG, against 1.5 million. Kpler put the region’s flows of clean products such as diesel and jet fuel at about half their pre-war level. That is the gap Kuwait’s oil chief was describing in October: crude exports back to pre-war levels, and too few tankers for jet fuel and diesel.
Diesel shows what that gap costs. Wholesale diesel topped $200 a barrel in Singapore in mid-September and reached all-time highs of around $220 in Europe and the United States. In the third quarter the world had 1.7 million barrels a day less diesel and gasoil available than a year earlier. Diesel accounts for a quarter of the fall in oil demand the IEA expects for 2026, and the agency expects little rebuilding of depleted gasoil stocks, beyond normal seasonal swings, before the second half of 2027.
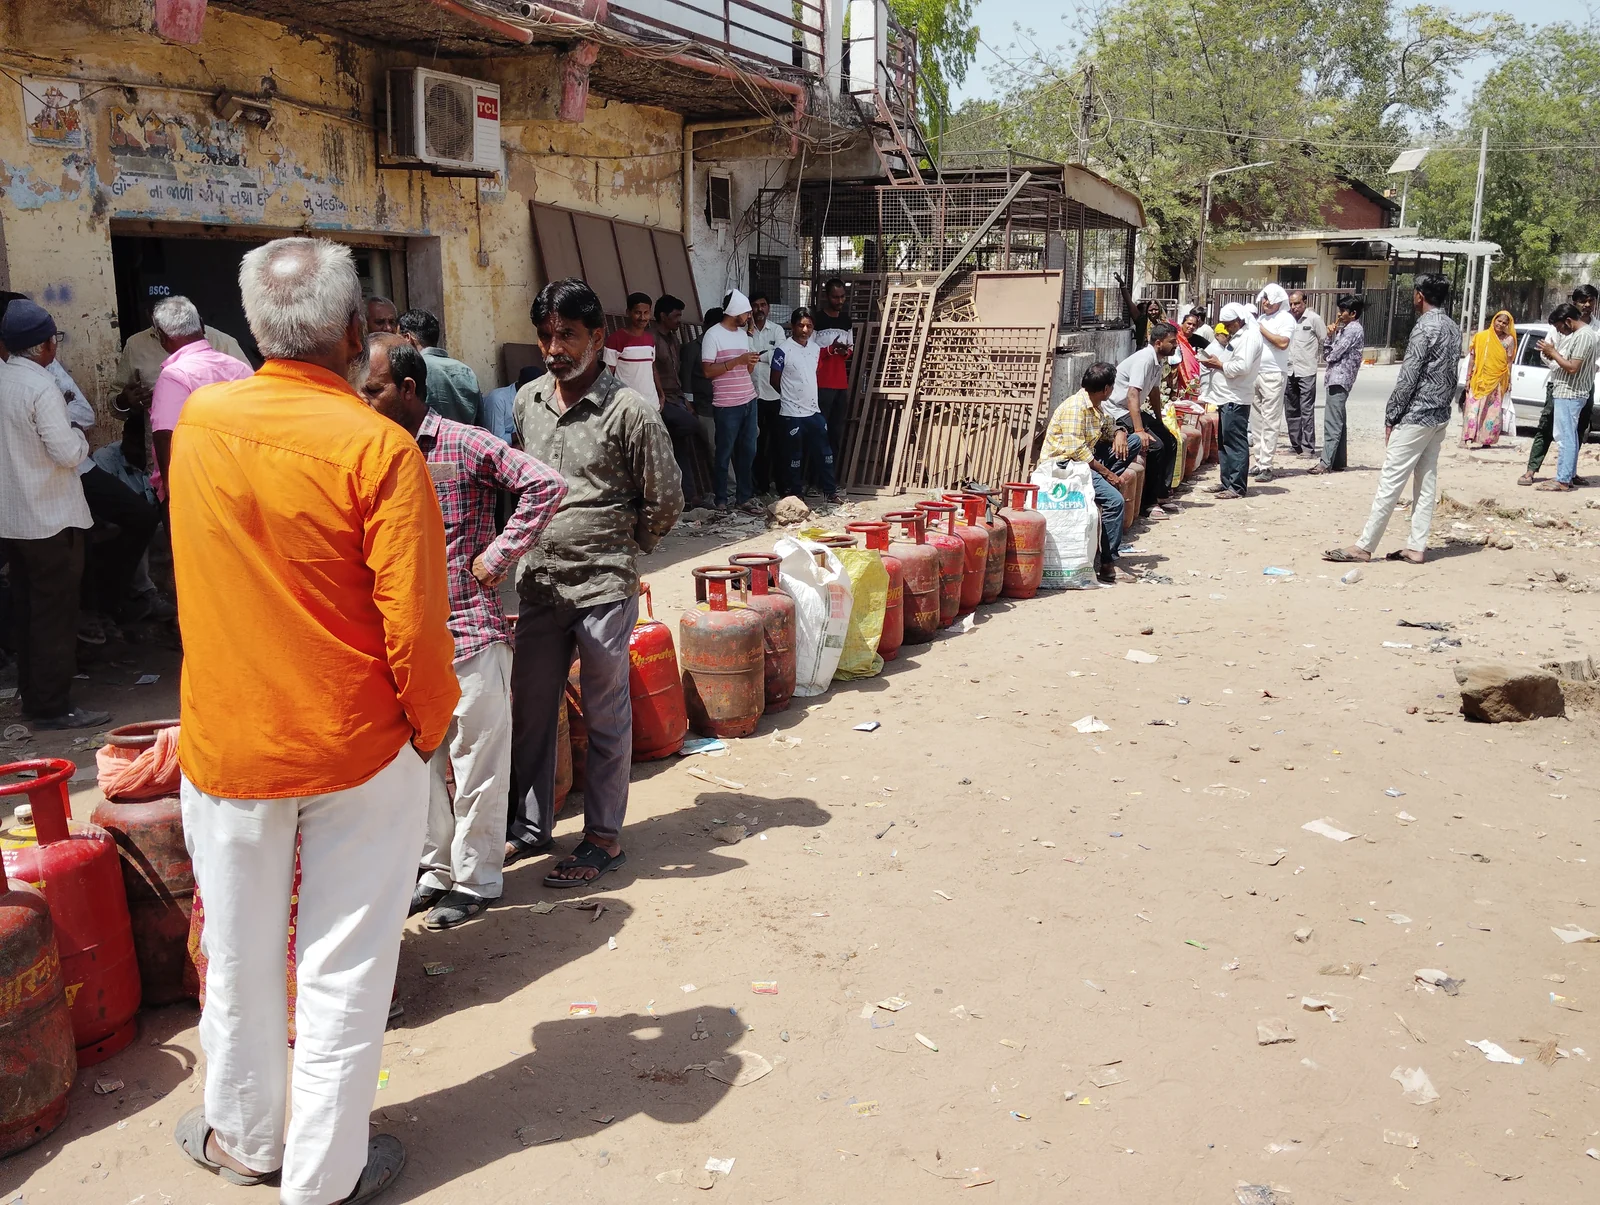
LPG shows how the shortage reaches a kitchen. India takes more than 45% of the Gulf’s LPG exports. About two-thirds of the LPG India used in 2025 came from the Gulf, and almost 90% of Indian LPG goes to homes for cooking and heating. India has no substantial LPG storage, so a lost cargo hits consumption quickly. In March, India’s demand for LPG and ethane combined was 12.5% lower than a year earlier. From June, Gulf LPG exports recovered as tankers shuttled cargoes out of the Gulf to transfer them at sea. Then the October attacks cut that shuttle trade from 432,000 barrels a day in September to a pace of 177,000 in the first half of October, just as seasonal demand in Asia rises.
Emergency stocks did less for cooking gas than for crude. The March emergency-stock release was largely crude, with Europe’s contributions mainly refined products. Crude itself was not interchangeable either. In the spring, the bypass pipelines were restricted to lighter grades, leaving heavier Saudi, Emirati, Iraqi and Kuwaiti crude effectively locked in the Gulf.
Gas fared worst. Qatar’s LNG plant at Ras Laffan was hit in March, and QatarEnergy’s chief executive, Saad Sherida Al-Kaabi, then estimated that 17% of the country’s export capacity would be lost for three to five years. By September Al-Kaabi, who is also Qatar’s energy minister, put the repairs at about three years, and said Qatar was exporting “very little” because “we can’t export through the Hormuz Strait”. QatarEnergy has declared force majeure every month since March. In September Qatar’s LNG exports were the highest since the war began, at 1.6 million tonnes, and still less than a quarter of the pre-war average. In mid-October the month was on track for just 0.6 million tonnes. On 22 October QatarEnergy signed a long-term deal to buy American LNG, which an analyst, Alex Munton, read as a sign that Qatar sees a risk that freedom of navigation never returns to Hormuz.
Who paid, and in what
Consumers paid through prices, through rationing and through their governments’ budgets. Pakistan first offered targeted subsidies to farmers and transport and then had to scale them back as the crisis wore on. The International Monetary Fund (IMF) expects global inflation of 4.7% in 2026.
Some producers paid in lost revenue. By April Iraq was the major producer hardest hit by lost oil export earnings, with very limited financial buffers to ride out a long closure. In October the IMF forecast that Qatar’s economy would shrink 15.6% in 2026, against pre-war expectations of 6.1% growth, and that the Middle East and Central Asia as a whole would contract.
Others sold more, or at higher prices. US petroleum exports reached a record 13.6 million barrels a day in April as the Hormuz disruptions raised global demand for them. Russia’s oil export revenues nearly doubled in March, from $9.7 billion to $19 billion. Saudi Aramco’s first-quarter net profit jumped 25% to $32.5 billion.
One cost has outlasted the recovery in volumes. Tanker rates reached records in September as insurance costs rose, and raised the cost of delivering crude to refiners. In Kpler’s words, buyers can regain access to Middle East barrels “without regaining pre-conflict delivered costs”.
The crews carry another kind of cost. By mid-October, by the IMO’s count as reported on 21 October, 24 seafarers had died since the war began, and around 6,000 remained trapped. On 14 October the Singapore-flagged container ship GFS Pride sank near the strait after being hit by a projectile; its 21 crew were evacuated. The bulk carrier Cape Dao, struck on 23 September, sank near the strait weeks later. One of its crew had been killed in the strike.
A thinner cushion
In 2008 Caitlin Talmadge, assessing Iran’s threat to the strait, judged that if Iran could properly link its military capabilities, it could halt or impede traffic in the strait “for a month or more”. The disruption of 2026 has lasted nearly eight months. Even so, Gulf crude exports touched pre-war levels in October, and the IMF still expects the world economy to grow 3.1% in 2026, against 3.5% in 2025.
That growth figure does not measure what the closure cost. It assumes that Hormuz gradually reopens from March 2027, with pre-war conditions restored by October that year, and that oil averages $96 a barrel in 2026. The world absorbed the shock by spending its buffers, and by October those buffers were much thinner. By the end of September global observed stocks were 509 million barrels below their pre-war level, and stocks held on land were near their lowest since at least 2016. By mid-October IEA members had released about 330 million barrels of emergency stocks, and they agreed to complete the remaining 100 million or so, which the G7 had pledged on 2 October to release over four months, with diesel front-loaded. In October the IEA expected oil balances to stay in deficit through the end of the year and warned that “remaining buffers in the system continue to erode”.
China’s crude buying picked up in the autumn. Its imports are expected to rise above 10 million barrels a day in October, the most since March, on cargoes arranged in early August, when Brent dipped below $80. In the week to 19 October, China’s onshore crude stocks rose for the second week running, to 1.192 billion barrels.
And the recovery is happening under fire. The IEA called it “fragile” in mid-October. At least 28 attacks or security incidents were recorded in the first half of October, already the highest monthly total of the war. As Houthi attacks on Saudi Arabia escalated, the US ordered non-emergency government staff and their families out of the kingdom, and Saudi Aramco told staff to leave its Dhahran headquarters and work remotely. The New York Times reported that the US and Israel had plans for fresh strikes on Iran after the US midterm elections. Whether Washington and Tehran were negotiating at all was disputed: President Trump said on 21 October that the US was not negotiating with Iran, while other reports had negotiators still talking about Iran’s nuclear programme and the strait. On 23 October the US ambassador to the UN, Mike Waltz, said the war could last another year. That day Brent settled at $116.72 a barrel, its highest close since 29 April.
Related articles
- What OPEC actually is now: the economics of a cartel that is slowly dismantling itself
- How France’s school protests met the cost-of-living revolt
- The floating borders: how maritime law decides who owns the sea
Further reading
As an Amazon Associate, Eikleaf earns from qualifying purchases. The book links below are affiliate links: if you buy through them, we may earn a small commission at no extra cost to you.
 The Prize: The Epic Quest for Oil, Money & PowerThe standard history of oil, including earlier supply shocks and the creation of the IEA.
 The New Map: Energy, Climate, and the Clash of NationsHow shale, LNG and Gulf geopolitics changed the way the world absorbs an oil shock.Windfall: How the New Energy Abundance Upends Global Politics and Strengthens America’s PowerWindfall: How the New Energy Abundance Upends Global Politics and Strengthens America’s PowerWhy US shale output changed the impact of Middle East supply disruptions.
Recommended videos
 6:29How high could the oil price go? | The EconomistThe Economist on how high oil could go with Hormuz shipping disrupted.
 14:03The IEA’s largest ever emergency oil stock releaseThe IEA explains its record emergency oil stock release during the Hormuz crisis.
 1:51Why the Diesel Fuel Crisis Has No Easy SolutionsWSJ on why the diesel crunch has no quick fix even as crude flows return.
Cite this article
Lena Martin. “How the world absorbed the Hormuz oil shock.” Eikleaf, 24 October 2026, updated 25 October 2026. https://www.eikleaf.com/how-the-world-absorbed-the-hormuz-oil-shock/
Gen AI Disclaimer
Some contents of this page were generated and/or edited with the help of a Generative AI.
Media
Gulf of Oman and the Strait of Hormuz at night – NASA, Wikimedia Commons
Earnest Will convoy, 22 August 1987 – U.S. Navy, Wikimedia Commons
LPG cylinder queues in Mehsana, Gujarat, 2026 – Wikimedia Commons (Photo: Nizil Shah, CC BY-SA 3.0)
Key Sources and References
International Energy Agency. “Oil Market Report — October 2026.” 14 October 2026. https://www.iea.org/reports/oil-market-report-october-2026
Bosoni, Toril. “Oil markets strain to plug the gap left by Middle East supply shortfall.” International Energy Agency, 18 September 2026. https://www.iea.org/commentaries/oil-markets-strain-to-plug-the-gap-left-by-middle-east-supply-shortfall
International Energy Agency. “Oil Market Report — April 2026.” 14 April 2026. https://iea.blob.core.windows.net/assets/515f3128-df1a-4d6c-beb4-fd91d2434bef/-14APR2026_OilMarketReport_Free_version1.pdf
International Energy Agency. “Oil Market Report — March 2026.” 12 March 2026. https://iea.blob.core.windows.net/assets/a25ddf53-cd6c-4910-ac90-16bfd28399e7/-12MAR2026_OilMarketReport.pdf
International Energy Agency. “Oil Market Report glossary.” Accessed 23 October 2026. https://www.iea.org/articles/oil-market-report-glossary
International Energy Agency. “IEA confirms member country contributions to collective action to release oil stocks in response to Middle East disruptions.” 19 March 2026. https://iea.org/news/iea-confirms-member-country-contributions-to-collective-action-to-release-oil-stocks-in-response-to-middle-east-disruptions
International Energy Agency. “IEA Governing Board statement on energy markets and security.” 15 October 2026. https://www.iea.org/news/iea-governing-board-statement-on-energy-markets-and-security
U.S. Energy Information Administration. “Short-Term Energy Outlook, October 2026.” 6 October 2026. https://www.eia.gov/outlooks/steo/archives/oct26.pdf
U.S. Energy Information Administration. “Amid regional conflict, the Strait of Hormuz remains critical oil chokepoint.” Today in Energy, 16 June 2025. https://www.eia.gov/todayinenergy/detail.php?id=65504
U.S. Energy Information Administration. “China, the United States, and Japan hold most strategic oil inventories in 2025.” Today in Energy, 20 April 2026. https://www.eia.gov/todayinenergy/detail.php?id=67504
U.S. Energy Information Administration. “U.S. exports of crude oil and petroleum products reached record in April.” Today in Energy, 8 July 2026. https://www.eia.gov/todayinenergy/detail.php?id=67825
Russell, Clyde. “China uses crude stockpiles, but rising oil imports may curtail draws.” Reuters column, via The Star, 22 October 2026. https://www.thestar.com.my/business/insight/2026/10/22/china-uses-crude-stockpiles-but-rising-oil-imports-may-curtail-draws
Xu, Muyu. “Chinese refiners step up Middle East crude buying amid record stock drawdowns.” Kpler, 14 October 2026. https://www.kpler.com/blog/chinese-refiners-step-up-middle-east-crude-buying-amid-record-stock-drawdowns
Rauball, Johannes. “Seven months on: 2 bn bbl lost, 5 Mbd still offline, and no deal in sight.” Kpler, 20 October 2026. https://www.kpler.com/blog/seven-months-on-2-bn-bbl-lost-5-mbd-still-offline-and-no-deal-in-sight
Kpler. “Kpler Media Briefing, 23 October 2026: Middle East Energy and Maritime Disruptions.” 23 October 2026. https://marketing.kpler.com/hubfs/Media%20Briefings%20pdfs/Kpler%20media%20briefing%2023%20Oct%202026.pdf
Wright, Matt. “Hormuz: Normalisation no longer needs to wait for a deal.” Kpler, 1 October 2026. https://www.kpler.com/blog/hormuz-normalisation-no-longer-needs-to-wait-for-a-deal-08156
Belostrino, Emmanuel. “60 days of a broken US-Iran MoU: the market stopped waiting for Hormuz.” Kpler, 19 August 2026. https://www.kpler.com/blog/60-days-of-a-broken-us-iran-mou-the-market-stopped-waiting-for-hormuz
Belostrino, Emmanuel. “Explainer: the nuances of reading Hormuz oil flows data.” Kpler, updated 20 October 2026. https://www.kpler.com/blog/explainer-the-nuances-of-reading-hormuz-oil-flows-data
Jenson, Nils. “Increased Strait of Hormuz attacks hamper growing LPG shuttle trade.” Kpler, 20 October 2026. https://www.kpler.com/blog/increased-strait-of-hormuz-attacks-hamper-growing-lpg-shuttle-trade
Lloyd’s List Intelligence. “Strait of Hormuz Brief: 22 October, 2026.” 22 October 2026. https://www.lloydslistintelligence.com/resources/blog/strait-of-hormuz-brief-22-october-2026
Matsuyama, K., and A. Longley. “Oil Surges 4% After Deadly Saudi Attacks.” Bloomberg, via Rigzone, 22 October 2026. https://rigzone.com/news/wire/oil_surges_4_after_deadly_saudi_attacks-22-oct-2026-184912-article
Kimball, Spencer, and Chloe Taylor. “Brent crude oil tops $116, a six-month high, as tensions swell in the Middle East.” 23 October 2026. https://cnbc.com/2026/10/23/oil-price-brent-wti-iran-war-saudi-arabia.html
Bao, Anniek. “U.S. pulls diplomats from Saudi Arabia as it reportedly readies Iran strikes after midterms.” CNBC, 22 October 2026. https://www.cnbc.com/2026/10/22/us-iran-trump-hormuz-.html
Kimball, Spencer, and Deena Zaidi. “Qatar deal to buy U.S. natural gas shows how Iran war has redrawn global energy markets.” CNBC, 23 October 2026. https://www.cnbc.com/2026/10/23/cheniere-qatar-energy-lng-natural-gas-iran-war-strait-hormuz.html
CBS News. “Iran War Updates: Trump’s U.N. ambassador says war could last another year as oil prices continue rising.” 23 October 2026. https://www.cbsnews.com/live-updates/iran-war-trump-us-oil-gas-prices-strait-of-hormuz-midterms/
Associated Press. “Iran says 7 oil tankers damaged in Strait of Hormuz, and other Middle East news.” PBS NewsHour, 22 October 2026. https://www.pbs.org/newshour/amp/world/iran-says-7-oil-tankers-damaged-in-strait-of-hormuz-and-other-middle-east-news
Al Jazeera. “Iran says seven ships hit in Hormuz Strait, warns US of wider response.” 22 October 2026. https://aljazeera.com/news/2026/10/22/iran-says-seven-ships-hit-in-hormuz-strait-warns-us-of-wider-response
Shankar, Priyanka. “Tehran’s ‘toll booth’: How Iran picks who to let through Strait of Hormuz.” Al Jazeera, 26 March 2026. https://www.aljazeera.com/news/2026/3/26/tehranstollbooth-how-iran-picks-who-to-let-through-strait-of-hormuz
Motamedi, Maziar. “What to expect after the US reimposes naval blockade on Iran’s ports?” Al Jazeera, 18 July 2026. https://www.aljazeera.com/economy/2026/7/18/what-to-expect-after-the-us-reimposes-naval-blockade-on-irans-ports
Duggal, Hanna, Marium Ali and Mohamed Hussein. “How a 95 percent drop in Hormuz traffic changed global shipping.” Al Jazeera, 27 August 2026. https://www.aljazeera.com/news/2026/8/27/how-a-95-percent-drop-in-hormuz-traffic-changed-global-shipping
Quillen, Stephen. “How much oil is going through Hormuz? Why data doesn’t match US claims.” Al Jazeera, 3 September 2026. https://www.aljazeera.com/news/2026/9/3/how-much-oil-is-going-through-hormuz-how-data-doesnt-match-us-claims
Reuters. “Strait of Hormuz tanker crossings fall to lowest level in more than two months, data shows.” Via The National, 24 July 2026. https://www.thenationalnews.com/news/mena/2026/07/24/hormuz-tanker-crossings-fall-to-lowest-level-in-more-than-two-months-data-shows/
Alioglu, Yusuf, and Rania Abushamala. “What is Saudi Arabia’s East-West pipeline, and what its ‘precautionary’ shutdown means?” Anadolu Agency, 12 September 2026. https://www.aa.com.tr/en/energy/oil/what-is-saudi-arabia-s-east-west-pipeline-and-what-its-precautionary-shutdown-means/59580
Pipeline & Gas Journal. “Aramco Runs East-West Pipeline at Full Capacity Amid Hormuz Disruptions.” 11 May 2026. https://pgjonline.com/news/2026/may/aramco-runs-east-west-pipeline-at-full-capacity-amid-hormuz-disruptions
Kumar, Sanjay. “India sees surge in crude oil imports from Middle East.” Arab News, 3 October 2026. https://www.arabnews.com/world/india-sees-surge-in-crude-oil-imports-from-middle-east-3004400
Khawaja, Usama Iqbal. “Sindh announces schools’ closure from Mar. 16-31, new austerity measures to conserve fuel.” Arab News Pakistan, 10 March 2026. https://www.arabnews.pk/pakistan/sindh-announces-schools-closure-from-mar-16-31-new-austerity-measures-to-conserve-fuel-2635923
Balci, Gokcay, and Ebru Surucu-Balci. “Some countries in Asia are rationing energy – why they’ve been hit hardest by the crisis in the Gulf.” The Conversation, 9 April 2026. https://theconversation.com/some-countries-in-asia-are-rationing-energy-why-theyve-been-hit-hardest-by-the-crisis-in-the-gulf-279888
El Dahan, Maha, Andrew Mills and Yousef Saba. “Iran Attack Wipes Out 17% of Qatar’s LNG Capacity for up to Five Years.” Reuters, via gCaptain, 19 March 2026. https://gcaptain.com/iran-attack-wipes-out-17-of-qatars-lng-capacity-for-up-to-five-years/
Bousso, Ron. “Middle East LNG industry remains hostage of Iran war.” Reuters column, via BOE Report, 12 October 2026. https://boereport.com/2026/10/12/middle-east-lng-industry-remains-hostage-of-iran-war-bousso/amp/
Kurtenbach, Elaine (Associated Press). “IMF raises 2026 global growth forecast to 3.1%.” Fortune, 13 October 2026. https://fortune.com/2026/10/13/imf-global-growth-forecast-2026-ai-economic-divide/
Fitzgerald, Kyle. “IMF cuts 2026 growth forecasts for Gulf economies due to prolonged Hormuz closure.” The National, 13 October 2026. https://thenationalnews.com/business/economy/2026/10/13/imf-cuts-2026-growth-forecasts-for-gulf-economies-due-to-prolonged-hormuz-closure/
G7 Leaders. “G7 Leaders’ statement on global energy security and market stability.” 2 October 2026. https://www.pm.gc.ca/en/news/statements/2026/10/02/g7-leaders-statement-global-energy-security-and-market-stability
Reuters. “Two ships sink near Hormuz after being hit by projectiles amid surge in attacks.” Via ARY News, 15 October 2026. https://arynews.tv/two-ships-sink-near-hormuz-after-being-hit-by-projectiles
Psara, Souzana. “6,000 seafarers trapped as attacks deepen Strait of Hormuz shipping crisis.” Cyprus Mail, 21 October 2026. https://cyprus-mail.com/2026/10/21/6000-seafarers-trapped-as-attacks-deepen-strait-of-hormuz-shipping-crisis
Library of Congress, Federal Research Division. “Iraq: The Tanker War, 1984–87.” Iraq: A Country Study, 1988. https://countrystudies.us/iraq/105.htm
Phillips, Stephen. “Revisiting the Tanker War.” War on the Rocks, 20 March 2024. https://warontherocks.com/revisiting-the-tanker-war/
Talmadge, Caitlin. “Closing Time: Assessing the Iranian Threat to the Strait of Hormuz.” International Security 33, no. 1, Summer 2008. https://www.belfercenter.org/publication/closing-time-assessing-iranian-threat-strait-hormuz