Last updated: · 18 min read
In brief
In August the US Treasury sold a 30-year bond for about $98.63 per $100; by October the same promise fetched about $92.89. Demand was strong. Lenders simply wanted more, and long yields across rich countries hit their highest in years. American numbers show neither fear of default nor runaway inflation; one model credits most of the 10-year rise to expected short-term rates. Even Germany, with debt near 63% of GDP, saw its highest yield since 2011. As maturing debt is refinanced at higher rates, interest payments have climbed from 2% to nearly 3% of global GDP in four years.
Contents
On 13 August 2026 the US Treasury sold a new 30-year bond. It matures on 15 August 2056, and the auction fixed its coupon at 5.125%: for every $100 of face value, the government promised to pay $5.125 a year until then and hand back the $100 at the end. Buyers accepted a yield of 5.216%, which set the price at about $98.63 for each $100 of bond.
The Treasury sold more of the same bond on 10 September, at a yield of 5.308%, and again on 8 October, at 5.618%. The coupon couldn’t change, because it had been written into the bond in August. The only thing left to give was the price. In October the auction set it at about $92.89 for each $100 of face value. The government made the identical promise three times, and each time it got less money for it.
A bond’s yield is the annual return built into its price: what a buyer earns by paying that price for a fixed stream of payments and holding the bond to the end. Pay less than face value for the same coupons and the return rises, because the buyer still collects the full $100 in 2056. So prices and yields move in opposite directions, and a yield above the coupon means a price below $100.
The sale itself went well. Bids on 8 October came to 2.54 times the $22bn on offer, and indirect bidders, the Treasury’s category for customers who bid through a dealer or another firm that bids directly, took 72.3% of the sale against an average of 68% over the previous ten auctions. At that yield there was no shortage of lenders willing to tie up money with Washington for three decades. They simply wanted far more for it. On 13 August 2020 the Treasury had sold 30-year bonds at a yield of 1.406%, roughly a quarter of the October figure.
The American bond had company. The US 10-year yield closed at 5.31% on 5 October, its highest close since May 2002. Japan’s 30-year yield closed at a record 4.168% the next day, and in the first week of October Britain’s 30-year gilt yield rose above 6% for the first time since 1998. Germany’s peak came a little earlier: on 28 September its 10-year yield, on the Bundesbank’s curve, reached the highest level since 2011. The IMF reckons the average 10-year yield across the G7 rose by more than a percentage point between February and September, to its highest in nearly two decades. For a household the number lands on the mortgage: the average 30-year fixed rate in the United States was 7.32% on 22 October, against 6.19% a year earlier. World government debt, nearly 94% of global output in 2025, is on course to reach 100% by 2029 on the IMF’s projections.
So what, exactly, is the extra four percentage points on that 30-year bond paying for?
What a long yield is made of
Lending to a government for ten or thirty years competes with a simpler alternative: lending to it for a few months at a time and rolling the loan over. Short-term rates are set, near enough, by the central bank. So the first part of any long yield is the average short-term rate investors expect over the bond’s life. If they think overnight rates will average about 4% over the next decade, a 10-year bond yielding 3% looks like poor value, and, other things equal, its price falls until the yield climbs closer to that level.
The second part is the term premium, the extra yield investors want for the risks of holding a long bond. Locking money up for thirty years means living with whatever happens in between: inflation might jump, central banks might raise rates further than anyone expected, other buyers might drift away, and any of these would knock down the price of a bond already bought. When those risks feel large, lenders want paying for them. When long bonds are scarce, or prized as insurance against a crash, the premium shrinks and can even turn negative.
Neither part appears on any trading screen. Markets quote the yield, and the split between expected rates and premium has to be estimated with models, and models can disagree. Short yields respond most to what central banks are expected to do over the next year or two. Long yields carry those expectations too, spread across many more years, along with whatever premium investors demand for the wait.
A second cut through the same yield uses inflation-protected bonds, known in America as TIPS, whose coupon and principal payments move with the consumer price index. Their yield is a real yield, the return after inflation. The gap between an ordinary bond’s yield and the TIPS yield of the same maturity is called breakeven inflation. It is a market measure of inflation compensation, not a clean read of what investors expect prices to do: it contains a premium for the risk of an inflation surprise, and TIPS trade less easily than ordinary Treasuries, which distorts their price. Even so, if breakeven inflation barely moves while yields jump, the jump came through real yields.
Each country’s own circumstances bear on both parts: how much it owes, how its politics behave, who buys its bonds and what its central bank is doing. They are why the same year has treated Berlin, London and Tokyo so differently.
The American evidence
The shock came from the Gulf. The US–Israeli war with Iran began in February, and on 9 March bonds sold off around the world as oil rose well above $115 a barrel. Government bonds are a usual refuge in wartime, but this time the appeal was overlooked: investors feared central banks would have to keep rates higher for longer, or raise them. “Today is much more like in panic mode,” Lyn Graham-Taylor, a rates strategist at Rabobank in London, said that day.
The inflation arrived. US consumer prices rose 3.7% in the twelve months to September, with the energy index up 20.4%. On 16 September the Federal Reserve raised its benchmark rate by a quarter point, to a range of 3.75% to 4%, its first increase since 2023. “Inflation remains elevated,” its statement said, and 16 of the 18 officials who submitted projections expected another rise. The European Central Bank had raised its deposit rate in June and again in September, and the Bank of Japan took its policy rate to 1.25%, the highest since 1995.
Two readings of the US 10-year yield show where the rise came from, and a model then splits it further. The first is the simplest. On 27 February, just before the war, the 10-year closed at 3.97%. By 23 October it was 5.00%. Over the same stretch the 10-year real yield rose from 1.72% to 2.66%, almost the whole move, while breakeven inflation went from 2.25% to 2.34%. Compensation for inflation over the decade barely changed; nearly all the extra yield was a higher return after inflation.
The second reading comes from the Fed’s own staff, using a different method. Reviewing the weeks before the September meeting, they found that near-term inflation compensation rose, mostly with oil, and that it accounted for most of the increase in shorter yields. Real rates accounted for most of the increase in longer ones. Even after rising, inflation compensation was still consistent with inflation returning to the Fed’s 2% target.
The split between expected rates and premium comes from the term-premium model kept by the New York Fed. On its estimates, the fitted 10-year yield rose 1.24 points from 27 February to 7 October, the day the premium peaked. About 0.85 of that came from higher expected short-term rates and about 0.39 from the term premium. Roughly a third of the climb, then, was extra pay for risk, and on 7 October the premium stood at 0.98 points, its highest since June 2014. Then it fell back. By 22 October the model put it at 0.64, close to the 0.59 of late February, while the expected-rate part had not budged.
Part of the retreat came in a single day. On 22 October a steep sell-off in stocks, driven by worries about the artificial-intelligence trade, sent investors back into Treasuries, and the 10-year yield dropped more than 17 basis points (a basis point is a hundredth of a percentage point) to 4.972%. “For the first time in a while, Treasurys are enjoying haven status,” said Larry Holzenthaler, a fixed-income portfolio manager at Catalyst Funds. On the model, that day’s fall split about evenly between the two parts: some eight basis points from expected rates, eight from the premium.
The shape of the curve fits. From late February to 23 October the 2-year yield rose 1.31 points, the 10-year 1.03 and the 30-year 0.69. Short yields climbed most, as they do when markets reprice what central banks will do over the next couple of years.
Two stories are consistent with all this. In one, markets expect central banks to hold rates higher for longer to beat an oil-driven inflation. In the other, which the Fed’s market desk also described, the data point to “a resilient economy with persistent inflation”. Market commentary recorded in the Fed’s September minutes added other forces lifting the term premium: geopolitics, uncertainty over the Treasury’s bond buyback programme and competition for capital from heavy borrowing to build AI infrastructure. Either way, the American numbers don’t show investors fleeing a government they fear will default, or bracing for inflation to run away. On the New York Fed’s model, most of the rise in the 10-year yield since February is the expected path of short-term rates. That covers one country and one maturity, and the split itself rests on a model.
The premium that came back
The premium’s jumps in 2026 sit on top of a slower change. On the New York Fed model, the 10-year term premium was negative on every trading day of 2018, 2019, 2020 and 2022, and below zero on most days of 2021, 2023 and 2024. On 9 March 2020 it fell to minus 1.66 points, its lowest reading. Investors were accepting less for a 10-year bond than the short-term rates they expected over the decade would have paid them, in effect paying for the privilege of holding it. A negative premium is not a negative yield: the 10-year still paid 0.54% that day. Negative yields happened elsewhere. The same day Germany’s 10-year yield was minus 0.85%, which meant lenders were paying Berlin to look after their money for ten years. In 2025 and in 2026 up to 22 October, the American premium was positive every day.
How economists split a yield

No market trades the term premium. A Federal Reserve Board note put the problem plainly: the split between expected rates and premium "cannot be inferred directly from market prices", so it has to be estimated with econometric models. The New York Fed's version was built by Tobias Adrian, Richard Crump and Emanuel Moench, first published in 2008 and revised in 2013. It prices the whole Treasury curve using a three-step linear regression, estimates the path of short-term rates investors expect, and treats what remains of the yield as the premium. Other models get there differently. The Board's own Kim-Wright model also feeds in surveys of professional forecasters' predictions for short-term rates, and the note found that its long-maturity estimates and the New York Fed's can "differ materially at times", mainly because of those surveys. The sensible way to read any single model is for direction and turning points, checked against evidence that doesn't depend on it, such as the Fed staff's split of the 2026 rise into real rates and inflation compensation.
Those years of negative premiums had a setting: central banks held enormous amounts of government debt. The Bank of England bought £895bn of sterling debt, almost all of it gilts, between 2009 and 2021, in rounds of quantitative easing meant partly to keep long-term interest rates down. At the end of June 2026 the Bank of Japan still held 46.7% of all Japanese government bonds.
Each of them is stepping back in its own way. The Bank of England began selling gilts on 1 November 2022, and in September 2026 it paused sales for six months and stopped selling long-dated gilts altogether. The Bank of Japan is trimming its monthly bond purchases by about ¥200bn each quarter until early 2027, and its stated principle is that “long-term interest rates are to be formed in financial markets”. The Fed has been adding to its holdings again, but only of short-dated debt. Its instructions, restated in September, are to buy Treasury bills, and if needed notes with three years or less to run, to keep bank reserves ample, and to roll over every Treasury it holds as it matures. In the week to 21 October its holdings of ordinary Treasury notes and bonds, at about $3.6trn, were only $39.9bn higher than a year earlier.
Governments, meanwhile, are borrowing more. Germany expects record federal borrowing in 2026. In August the US Treasury said it planned to keep its regular note and bond auctions the same size for at least several quarters and to meet extra needs with bills, which keeps the new borrowing short.
A model can give the size of the premium but not its causes, and for those there are only attributions. The IMF’s view, published on 14 October, is that in the major advanced economies high debt, spending pressures and the prospect of heavy bond issuance are pushing up the yields investors demand to hold long-term bonds. Athanasios Vamvakidis of the IMF warned the same week of rising sovereign yields “on the back of inflation pressures, fiscal imbalances and massive issuance from sovereigns and increasingly from the private sector.”
Same storm, different damage
If debt alone drove yields, Germany would have had a quiet year. In 2025 its government debt was about 63% of GDP, against 102% for Britain, 124% for the United States and 207% for Japan. Yet its 10-year yield, measured on the Bundesbank’s curve, reached 3.69% on 28 September, the highest since April 2011. That counts against any explanation built on debt levels alone, though it doesn’t prove a single global cause either. Germany’s finance agency expects federal borrowing to hit a record €525.5bn in 2026 and to rise again in 2027, and says the federal government is in an expansionary phase of fiscal policy. The IMF projects German debt rising to nearly 74% of GDP by 2031 to pay for investment and defence. And Germany borrows in euros, whose interest rates have been set by the ECB since 1999. The ECB raised them twice in 2026.
Britain got hit harder than most. Its borrowing costs rose more sharply than those of most other European governments after the war began, on concerns about the country’s reliance on natural gas for heating and power. In early October investors expected the Bank of England to raise rates in November or December, its first increase since the war started. The approaching budget added a second worry. On 6 October the finance minister, John Healey, met economists from the gilt-edged market makers, the primary dealers in British government bonds, to gauge sentiment before his first budget on 28 October. His ministry said afterwards that he “emphasised the importance of fiscal credibility in a challenging global economic environment”. The next day the 30-year gilt yield jumped 13 basis points, to its highest since January 1998.

What broke in Britain in 2022

British defined-benefit pension funds used liability-driven investment (LDI) strategies, which let them borrow to hold more long gilts than their own money could buy, with a cushion to absorb losses. On 23 September 2022 the government announced an expansionary fiscal package, the so-called mini-budget, and long gilt yields rose 30 basis points that day. On 27 September the 30-year yield rose 67 basis points between morning and evening; the largest daily rise in data going back to 2000 had been 29. The move threatened to exceed the cushion for many LDI funds, which then had to sell gilts into a falling market or ask pension schemes for more cash. Each sale pushed prices lower and forced more sales, a spiral the Bank of England described as "self-reinforcing". On 28 September the Bank stepped into the long-gilt market. Ed Yardeni, who coined the term "bond vigilantes" in 1983, defined them in a single line: "[I]f the fiscal and monetary authorities won't regulate the economy, the bond investors will." Britain in 2022 had both: a sell-off over the mini-budget, made far worse by leveraged holders forced to sell.
The Bank of England has had to explain itself too. When it stopped selling long gilts on 17 September, long gilt prices rallied sharply. The Bank’s Andrew Bailey denied that the change was a response to deteriorating market conditions, and the Bank argues that the pace of its sales mostly affects when losses fall on the government, not how large they are. Healey’s budget is due on 28 October, the day the Fed is scheduled to announce its next rate decision.
Japan’s long end tells a similar story. By early October investors had grown worried that Prime Minister Sanae Takaichi’s spending plans could worsen the country’s finances. On 5 October the 30-year yield hit a record intraday high of 4.235% while the 2-year yield sat near 1.9%. When the Bank of Japan raised its rate to 1.25% on 18 September, two board members dissented, both appointed by Takaichi earlier in the year and both seen as reflationists. A rate rise normally lifts a country’s bond yields and its currency. This time the 10-year yield fell and the yen weakened, and economists pointed to the split vote, which suggested the bank might not take a very hawkish line. The IMF’s own breakdown of Japanese yields, published in April, credited both risk compensation and expectations of a higher policy rate.
The worry behind the British and Japanese moves has a name. The Bank for International Settlements described its most acute concern in 2023 as fiscal dominance, “a situation in which monetary policy is unable to tighten due to fiscal constraints”. These episodes don’t show it: the Fed and the Bank of Japan have both raised rates this year, and in early October investors expected the Bank of England to follow. What debt does change is how sharply markets react. The IMF says high debt makes market rates more sensitive to fiscal news, and that in the US long-term forward rates have grown more sensitive to projected government debt. Big markets also export their troubles. “In major advanced economies, the effects of fiscal indiscipline does not stop at the border. It travels to the rest of the world,” the IMF’s Rodrigo Valdés said on 14 October.
How a higher rate reaches a budget
A government doesn’t pay the yield on its latest auction across all its debt. It pays an effective rate, a blend of everything still outstanding, some borrowed at 1.4% in 2020 and some at 5.6% in October 2026. For fixed-rate bonds the blend shifts as old debt matures and is refinanced, and as each new deficit is financed at today’s rates. Some debt moves faster: American floating-rate notes reset their interest rate every week, and inflation-linked bonds pay more as prices rise. The IMF calls the arithmetic that follows the snowball effect. When the effective interest rate is higher than the growth rate of nominal GDP, the debt ratio rises by itself, even if taxes cover all spending other than interest, because the interest is then paid with new borrowing. What can stop it is the primary balance, the budget before interest payments. For any rate and growth rate there is a primary balance that holds the debt ratio steady, and a government that runs a bigger deficit than that watches the ratio climb.
The world as a whole is running that bigger deficit. The IMF puts the global primary deficit at about 3.3% of GDP in 2026, when stabilising the world’s debt ratio this year would take cutting it to around 2.6%. The pressure is building at the margin too: in a growing number of economies the rate paid on new debt now exceeds expected nominal growth, and the IMF projects the effective average cost of government financing to rise from 2.3% in 2021 to 3.7% by 2031. America runs a deficit of 7% to 8% of GDP while operating near full capacity, and the IMF projects its interest payments reaching 5.7% of GDP in 2031, roughly what the country is projected to spend on Social Security, its largest entitlement programme.
How fast that happens depends on how long a country borrowed for. Japan borrowed long when money was cheap. Its long average maturity means the effective rate on its debt has adjusted only gradually, and in April the IMF projected Japan’s debt ratio to fall by about 14 percentage points between 2025 and 2031, because interest costs would stay below growth. The IMF added the conditions: the effect will diminish as old low-cost debt matures and is refinanced at much higher rates, and the outlook could become less favourable because yields have already risen. The United States went the other way. Since the pandemic, Treasury bills have added nearly $5trn to federal debt, which has shortened the average maturity and means debt comes up for refinancing more often.
Quantitative easing adds a twist that the headline maturity hides. When a central bank buys long government bonds, it pays with reserves on which it owes banks interest. On the government’s books the debt looks long and safe. The BIS points out that the public sector as a whole, government and central bank together, has in fact become more sensitive to rate rises, because higher rates immediately raise the central bank’s interest bill on reserves and eat into the profits it hands back to the treasury.
World government debt reached nearly 94% of GDP in 2025, and on current trajectories the IMF sees it at 100% by 2029, a level previously reached only in the aftermath of the Second World War. On the IMF’s figures from 2019 onwards, the highest actual reading was 97.4%, in 2020. Worldwide, interest payments rose from 2% to nearly 3% of global GDP in four years, as governments refinanced maturing debt at the new, higher rates.
The case that this is just normal
Earlier decades offer a comparison. On the New York Fed’s estimates, the fitted 10-year yield was 7.68% in September 1994, with a term premium of 2.58 points, and the 10-year closed as high as 5.26% in June 2007. By that yardstick a 10-year yield of 5% is nothing exotic. The odd period was the one just ended. In January 2020 a Bank of England staff working paper by Paul Schmelzing, which reconstructed real interest rates back to the 14th century, suggested that real rates “could soon enter permanently negative territory”. That was a serious reading of a long trend, and it shows how far expectations had swung.
Higher real yields can also carry good news. The IMF’s list of forces pushing yields up includes stronger investment demand and higher expected growth linked to AI, and the Fed’s market desk saw a resilient economy. Faster nominal growth also helps the debt arithmetic, because it enlarges the denominator. The American data show neither an inflation panic nor a buyers’ strike.
The same IMF list, though, ends with a different sentence: “But fiscal fundamentals are central.” The rate on new debt is what feeds, bond by bond, into the effective rate, and in more economies it already exceeds expected growth. The US Treasury market has shown a change too. In April, Valdés noted that the premium US Treasuries once commanded over other advanced-economy debt was narrowing. “These are signs that markets are not as sanguine—as forgiving—as they were in the past,” he said. Higher borrowing costs leave Washington less room to absorb the next shock.
Two ways to borrow
For buyers at the October auction, the August bond’s yield was fixed at 5.618% to 2056, and for the Treasury that slice of its debt will cost the same whatever the Fed does next. That is one way to borrow when rates are high: pay up and lock the price in.
Britain is going the other way. Long gilts were once the backbone of British borrowing. They gave the country the longest average debt maturity of any major economy, and some insulation against rising interest rates. Demand from the domestic pension funds that bought them has largely faded. The financing plan Britain published in March cut conventional gilts of more than 15 years to 9.1% of its gilt sales for 2026/27, 4.3 percentage points less than in the previous year’s plan.
Britain’s shift towards shorter borrowing means more of its debt will come back to the market sooner, at whatever rates prevail then.
Related articles
- The geography of debt: why certain nations borrow in currencies they don’t control
- Dollar dominance – why the world’s most traded commodity isn’t oil
- What happens to a country’s debt when it ceases to exist
Further reading
As an Amazon Associate, Eikleaf earns from qualifying purchases. The book links below are affiliate links: if you buy through them, we may earn a small commission at no extra cost to you.
- The Price of Time: The Real Story of Interest — Edward Chancellor (2022). Hayek Prize-winning history of interest rates, explaining what years of near-zero rates did and why their end hits borrowers and governments.
- This Time Is Different: Eight Centuries of Financial Folly — Carmen M. Reinhart, Kenneth S. Rogoff (2009). The data-driven history of sovereign debt crises, showing how high public debt and rising borrowing costs have played out before.
- A History of Interest Rates (4th ed.) — Sidney Homer, Richard Sylla (1963). The standard reference on government borrowing costs from antiquity to modern bond markets, putting today’s yields in long-run context.
Recommended videos
 7:14Why Treasury yields are at 20-year highs – and why it mattersRecent PBS explainer on why Treasury yields hit 20-year highs and what it means for borrowers.
 12:57The Simple Economics Behind the Global Bond Sell-OffEconomist Justin Wolfers on the simple economics behind the global bond sell-off.
 5:17Why Bond Yields Are a Key Economic Barometer | WSJWSJ primer on how bond yields work and why they signal the economy’s direction.
Cite this article
Lena Martin. “Why rich governments are paying more to borrow, and who feels it.” Eikleaf, 24 October 2026, updated 25 October 2026. https://www.eikleaf.com/why-rich-governments-are-paying-more-to-borrow-and-who-feels-it/
Gen AI Disclaimer
Some contents of this page were generated and/or edited with the help of a Generative AI.
Media
United States Treasury Building – Wikimedia Commons (Photo: Rchuon24, CC BY-SA 3.0)
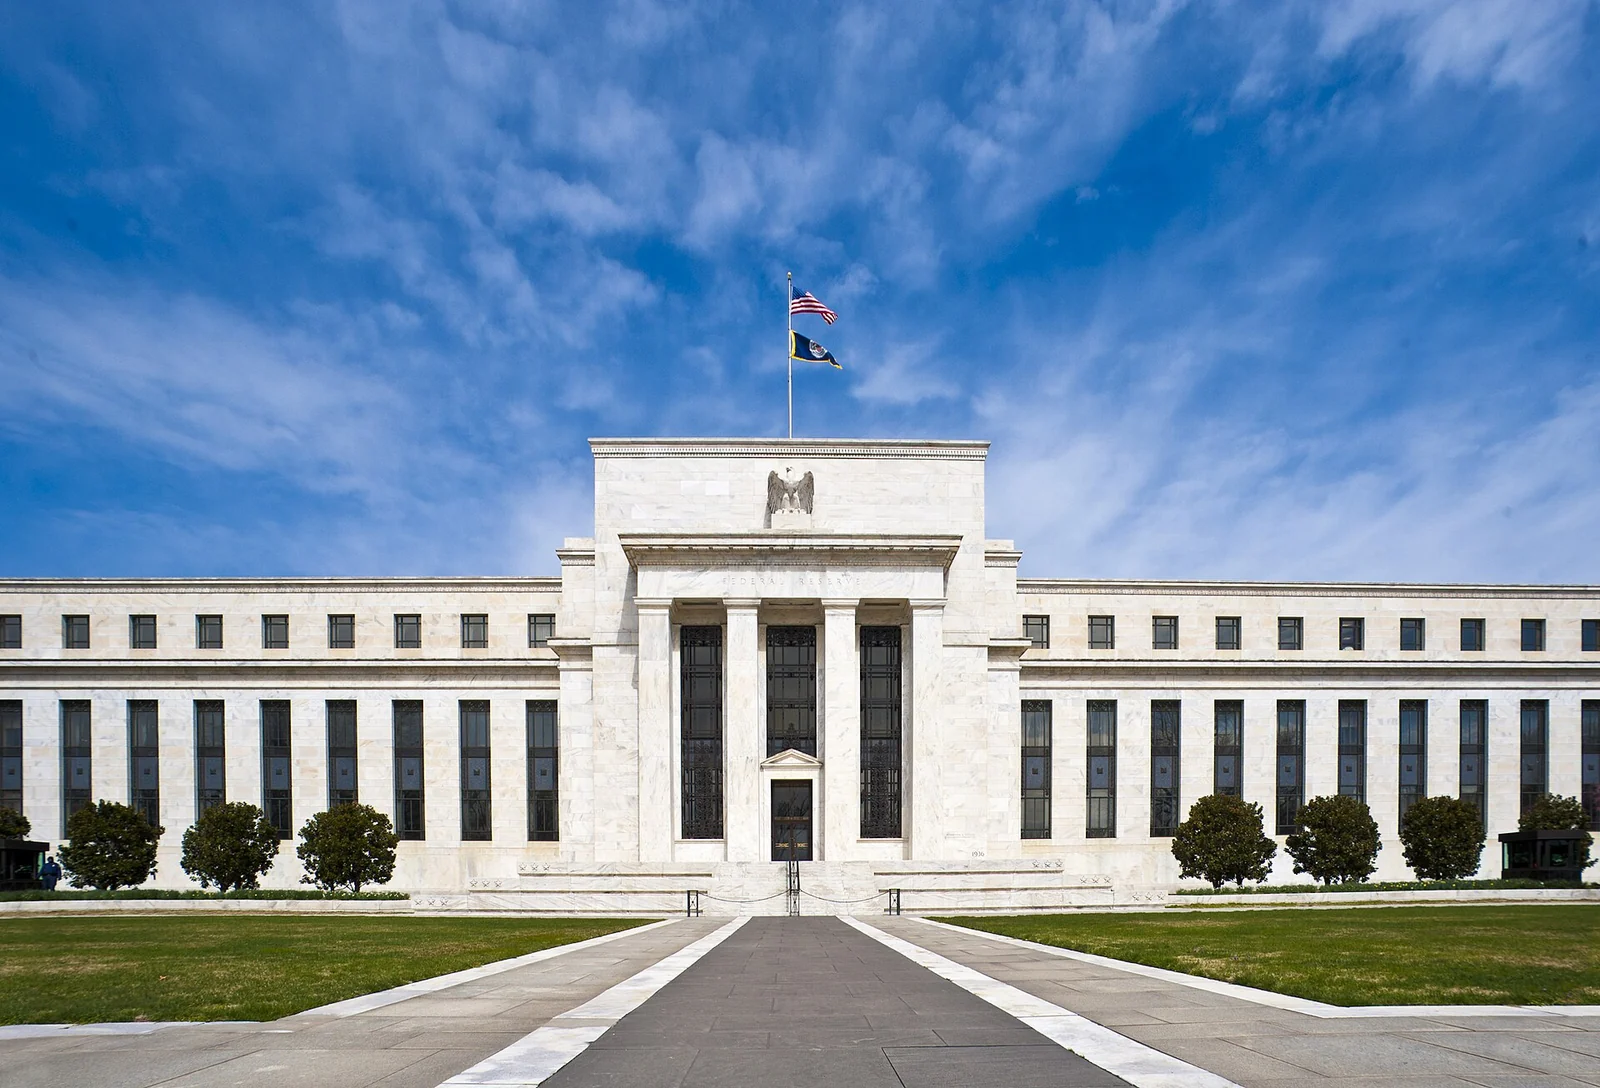
Eccles Building – Board of Governors of the Federal Reserve System
Bank of England entrance – Wikimedia Commons (Photo: The wub, CC BY-SA 4.0)
Key Sources and References
U.S. Department of the Treasury. “Daily Treasury Par Yield Curve Rates” and “Daily Treasury Par Real Yield Curve Rates,” 2002, 2007, 2020 and 2026 data (accessed 24 October 2026). https://home.treasury.gov/resource-center/data-chart-center/interest-rates/TextView?type=daily_treasury_yield_curve
TreasuryDirect. Auction results for CUSIP 912810UW6 (13 August, 10 September and 8 October 2026) (accessed 24 October 2026). https://www.treasurydirect.gov/TA_WS/securities/search?cusip=912810UW6&format=json
TreasuryDirect. Auction results for the 30-year bond auctioned 13 August 2020 (accessed 24 October 2026). https://www.treasurydirect.gov/TA_WS/securities/search?securityType=Bond&startDate=2020-07-01&endDate=2020-09-30&format=json
TreasuryDirect. “Understanding pricing and interest rates.” https://www.treasurydirect.gov/marketable-securities/understanding-pricing/
TreasuryDirect. “Auction FAQs.” https://www.treasurydirect.gov/help-center/faqs/auction-faqs/
TreasuryDirect. “Floating Rate Notes (FRNs).” https://www.treasurydirect.gov/marketable-securities/floating-rate-notes/
FINRA. “Bond Yield and Return.” https://www.finra.org/investors/insights/bond-yield-return
U.S. Department of the Treasury. Brian Smith, “Quarterly Refunding Statement,” 5 August 2026. https://home.treasury.gov/news/press-releases/sb0590
CNBC. “Treasury yields are lower after reaching multiyear highs, traders weigh latest bond auction,” 8 October 2026. https://www.cnbc.com/2026/10/08/us-treasury-yields-30-year-bond-auction.html
CNBC. “10-year Treasury yield tumbles below 5% to lowest level in nearly a month,” 22 October 2026. https://www.cnbc.com/2026/10/22/treasurys-bonds-ai-yields.html
CNBC. “Fed approves interest rate hike, signals one more to come this year,” 16 September 2026. https://www.cnbc.com/2026/09/16/fed-rate-decision-september-2026.html
CNBC. “Bank of Japan raises interest rates to 31-year high, flags concerns over inflation,” 18 September 2026. https://www.cnbc.com/2026/09/18/japan-raises-rates-30-year-high-yen-jgb.html
CNBC. “Why Japan’s markets flipped the usual script after central bank rate hike,” 18 September 2026. https://www.cnbc.com/2026/09/18/japan-rate-hike-stocks-rise-bond-yields-yen-fall.html
Japan Ministry of Finance. JGB interest rates (daily, current and historical). https://www.mof.go.jp/english/policy/jgbs/reference/interest_rate/
Japan Ministry of Finance. “Breakdown by JGB and T-Bill Holders (Jun. 2026, Preliminary Figures).” https://www.mof.go.jp/english/policy/jgbs/reference/Others/holdings01.pdf
Reuters. “Japan’s 30-year bond yields hit record high ahead of PM’s remarks,” 5 October 2026 (via The Standard). https://www.thestandard.com.hk/finance/article/344586/Japans-30-year-bond-yields-hit-record-high-ahead-of-PMs-remarks
Reuters. “UK 30-year gilt yields hit 28-year high in global selloff,” 7 October 2026 (via Euronext). https://live.euronext.com/en/financial-news/uk-30-year-gilt-yields-hit-28-year-high-global-selloff
Reuters. “UK 30-year gilt yields top 6% for the first time since 1998,” 1 October 2026 (via AOL). https://www.aol.com/articles/uk-30-gilt-yields-surge-074720000.html
Reuters. “Bank of England halts long-dated gilt sales, rewrites plan to unwind QE,” 17 September 2026 (via Euronext). https://live.euronext.com/en/financial-news/bank-england-sets-out-long-term-plan-unwind-qe-halts-long-dated-gilt-sales
Reuters. “Germany’s debt agency expects new record for borrowing in 2027,” 24 September 2026 (via Devdiscourse). https://www.devdiscourse.com/article/international/3981836-germanys-debt-agency-expects-new-record-for-borrowing-in-2027
Reuters. “From Europe to Asia, bond markets plunge as oil vaults above $115,” 9 March 2026 (via Yahoo Finance). https://finance.yahoo.com/news/europe-asia-bond-markets-plunge-094956552.html
HM Treasury. “Debt Management Report 2026-27,” 3 March 2026. https://www.gov.uk/government/publications/debt-management-report-2026-27
Milliken, David. “Bond dealers see small rise in UK debt issuance after budget, more in 2027: Reuters poll.” Reuters, 23 October 2026 (via Euronext). https://live.euronext.com/en/financial-news/bond-dealers-see-small-rise-uk-debt-issuance-after-budget-more-2027-reuters-poll
Deutsche Bundesbank. Term structure of interest rates on listed Federal securities (method by Svensson), residual maturity of 10 years, daily data. https://api.statistiken.bundesbank.de/rest/data/BBSIS/D.I.ZST.ZI.EUR.S1311.B.A604.R10XX.R.A.A._Z._Z.A?format=csv&lang=en
Dabla-Norris, Era and Rodrigo Valdés. “Rising sovereign yields raise the fiscal stakes.” IMF Blog, 14 October 2026. https://www.imf.org/en/blogs/articles/2026/10/13/rising-sovereign-yields-raise-the-fiscal-stakes
International Monetary Fund. Fiscal Monitor, April 2026: “Fiscal Policy under Pressure: High Debt, Rising Risks” (chapter 1, Table 1.2 and glossary). https://www.imf.org/-/media/files/publications/fiscal-monitor/2026/april/english/text.pdf
IMF Media Center. “IMF / Fiscal Monitor Report, Annual Meetings 2026” (remarks by Rodrigo Valdés), 14 October 2026. https://mediacenter.imf.org/news/imf—fiscal-monitor-report-annual-meetings–2026/s/1b05cec6-cde8-4b75-80ec-2b29f9fb5d19
United Nations UNifeed. “IMF / Global Financial Stability Report” (remarks by Athanasios Vamvakidis), October 2026. https://media.un.org/unifeed/en/asset/d365/d3651251
Lichtenberg, Nick. “A world going broke: IMF says America’s $39 trillion national debt is actually a global problem—and AI may be the only rescue.” Fortune, 16 April 2026 (via Yahoo Finance). https://finance.yahoo.com/economy/policy/articles/world-going-broke-imf-says-194850050.html
Freddie Mac. Primary Mortgage Market Survey, 22 October 2026. https://www.freddiemac.com/pmms
U.S. Bureau of Labor Statistics. “Consumer Price Index – September 2026,” 14 October 2026. https://www.bls.gov/news.release/archives/cpi_10142026.htm
Federal Reserve. FOMC statement and directive, 16 September 2026. https://www.federalreserve.gov/monetarypolicy/files/monetary20260916a1.pdf
Federal Reserve. Implementation note, 16 September 2026. https://www.federalreserve.gov/newsevents/pressreleases/monetary20260916a1.htm
Federal Reserve. Minutes of the Federal Open Market Committee, 15–16 September 2026. https://www.federalreserve.gov/monetarypolicy/fomcminutes20260916.htm
Federal Reserve. “Factors Affecting Reserve Balances (H.4.1),” 22 October 2026. https://www.federalreserve.gov/releases/h41/current/h41.htm
Federal Reserve. FOMC meeting calendars. https://www.federalreserve.gov/monetarypolicy/fomccalendars.htm
Adrian, Tobias, Richard K. Crump and Emanuel Moench. “Pricing the Term Structure with Linear Regressions.” Federal Reserve Bank of New York Staff Report 340, 2008, revised 2013; ACM term premium data (accessed 24 October 2026). https://www.newyorkfed.org/research/data_indicators/term-premia-tabs
Li, Canlin, Andrew Meldrum and Marius Rodriguez. “Robustness of long-maturity term premium estimates.” FEDS Notes, Federal Reserve Board, 3 April 2017. https://www.federalreserve.gov/econres/notes/feds-notes/robustness-of-long-maturity-term-premium-estimates-20170403.html
Andreasen, Martin M. and Jens H. E. Christensen. “TIPS Liquidity and the Outlook for Inflation.” FRBSF Economic Letter, Federal Reserve Bank of San Francisco, 21 November 2016. https://www.frbsf.org/research-and-insights/publications/economic-letter/2016/11/tips-liquidity-and-the-outlook-for-inflation/
European Central Bank. Deposit facility rate, daily series (ECB Data Portal). https://data-api.ecb.europa.eu/service/data/FM/D.U2.EUR.4F.KR.DFR.LEV?startPeriod=2026-01-01&format=csvdata
European Central Bank. “ECB, ESCB and the Eurosystem.” https://www.ecb.europa.eu/ecb/orga/escb/html/index.en.html
Bank of Japan. “Plan for the Outright Purchases of Japanese Government Bonds,” 16 June 2026. https://www.boj.or.jp/en/mopo/mpmdeci/mpr_2026/k260616b.pdf
Bank of England. “Report on the Bank’s official market operations 2022–23,” 6 July 2023. https://www.bankofengland.co.uk/sterling-monetary-framework/report-2022-23
Pinter, Gabor, Emil Siriwardane and Danny Walker. “Fire sales of safe assets.” Bank of England Staff Working Paper 1,089, July 2024. https://www.bankofengland.co.uk/-/media/boe/files/working-paper/2024/fire-sales-of-safe-assets.pdf
Cunliffe, Jon. Letter to the Chair of the Treasury Committee on LDI, Bank of England, 5 October 2022. https://www.bankofengland.co.uk/-/media/boe/files/letter/2022/october/letter-from-jon-cunliffe-ldi-5-october-2022
Bank for International Settlements. “Monetary and fiscal policy: safeguarding stability and trust.” Annual Economic Report 2023, chapter II. https://www.bis.org/publications/aer-2023/monetary-fiscal-policy-safeguarding-stability-trust
Schmelzing, Paul. “Eight centuries of global real interest rates, R-G, and the ‘suprasecular’ decline, 1311–2018.” Bank of England Staff Working Paper 845, 3 January 2020. https://www.bankofengland.co.uk/working-paper/2020/eight-centuries-of-global-real-interest-rates-r-g-and-the-suprasecular-decline-1311-2018
Yardeni, Edward. Morning Briefing, 22 August 2023. https://archive.yardeni.com/premiumdata/mb_230822.pdf
Daniel, Will. “The man who named the bond vigilantes 40 years ago just crowned a new king as the bond market goes through a multitrillion-dollar wobble.” Fortune, 25 October 2023. https://fortune.com/2023/10/25/bill-ackman-king-bond-vigilantes-ed-yardeni-says